While visiting a Case IH dealer several years ago a farmer walked into the dealership. As he joined in on our conversation it was clear he was a loyal John Deere customer, but he was also a good friend of the owner of the Case IH dealership. He said, “I just came from my dealer down the road and you know what? They don’t have a quart of green paint in that store. They told me they could have it for me by tomorrow. Can you believe that?”
The Case IH dealer replied, “I have plenty of red paint if you want it.”
The fact is equipment dealers have forever grappled with parts operations and inventories. It costs money to have parts and materials sitting in the back room or on the store shelf. Efforts to balance how much to have on hand to keep customers happy and how much to carry to minimize costs and maximize revenue is seldom, if ever, ideal.
By the time Farm Equipment conducted its last major survey on dealers’ parts operations in December 2014, it was clear the retail farm machinery business was slumping. (See “Getting a Handle on Your Parts Operations, Feb. 2015.) Compared to a year earlier, U.S. sales of row-crop tractors were down 12%, 4WD tractors had fallen 25% and combine sales had also declined by 25%. It only got worse from there.
In another earlier report from about the same time sales started dipping (see “Dealing with Ag’s Boom – Bust Cycles,” Farm Equipment, June 2013) Mike Boehlje, professor in the Dept. of Agricultural Economics and the Center for Food and Agricultural Business at Purdue University, gave equipment dealers a heads up if a sales downturn should occur.
Exclusively Online
He advised dealers to pay close attention to 8 critical factors that heavily influence the health of the ag industry. He also offered some suggestions about what dealers should do to prepare for a possible equipment sales slowdown. One of these was that dealers needed to re-emphasize their service and parts business. He said, “Farmers will have more need to repair their equipment rather than buying new. And dealers will need to have a financial reserve so that they have more absorptive capacity when sales volume declines.”
In that last survey, dealers seemed to indicate they were gearing up for the growing need for service and repair parts. Nearly three-quarters (72%) said they expected their parts sales to increase in 2015. Overall, they anticipated a 7.5% growth in parts sales that year.
How accurate were they in their forecasting?
Centralizing Parts Inventories
Question: If your dealership has multiple stores, have you consolidated service parts inventory into one location vs. stocking at multiple locations?
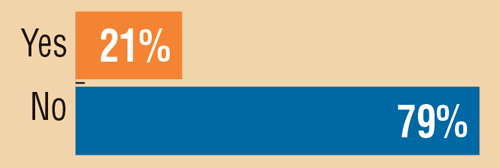
While 90% of the dealers responding to Farm Equipment’s 2017 parts operations survey indicated they were part of a multi-store dealership group, only about 20% say they have consolidated their parts inventory at a one location.
According to the Western Equipment Dealers Assn.’s (WEDA) 2013, 2014 and 2015 Cost of Doing Business studies, overall parts sales declined by 8% in 2014 compared to the previous year. They grew about 6% between 2014-15 and another 6% between 2015-16.
While dealer’s projections weren’t off by too much, many said they should have been even better considering the continuing deterioration of new wholegoods sales during these years.
Part Sales vs. Equipment Sales
Part sales by North American farm equipment dealers measured as a percentage of total equipment sales during the past decade ranged from a high of 25.5% in 2009 to a low of 18.3% in 2014, according to the WEDA Cost of Doing Business studies for the 10 years from 2007-16. Over the course of that 10 year period, dealers averaged about 21% in parts sales to overall equipment sales (includes new and used wholegoods).
During that same period, Deere & Co.’s parts sales averaged roughly 17% per year, with a high of 22% in 2016 and a low of 14% in 2012. Because Deere includes construction equipment parts in its calculation, it’s difficult to correlate a direct comparison between Deere’s part sales and those of farm machinery dealers.
Nonetheless, it’s interesting to note how the world’s largest manufacturer of ag machinery stacks up to retailers of farm equipment during the same period of time. Also, keep in mind that dealers’ numbers are annual averages in millions of dollars and Deere’s are yearly total dollars in billions.
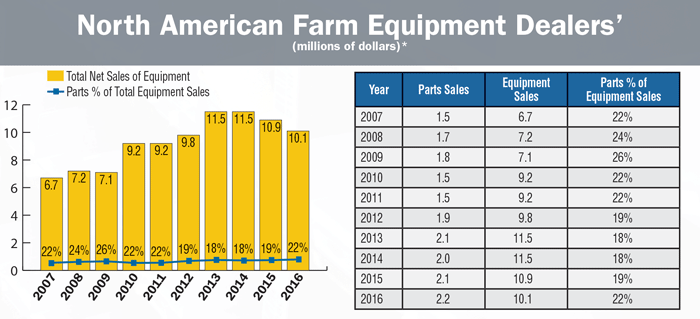
Between 2007 and 2016, North American farm equipment dealers’ parts sales as a percentage of total equipment sales varied from a low of 18% to a high of 26%. *Source: Western Equipment Dealers Assn. Cost of Doing Business studies
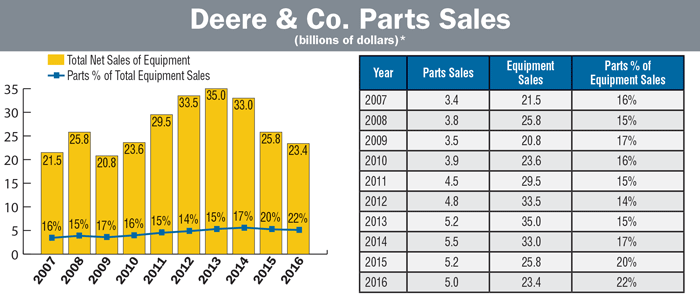
Between 2007 and 2014, Deere’s parts sales as a percentage of total equipment sales varied only slightly in the range of 15-17%, but saw larger increases in 2015 and 2016. *Deere & Co. December 2016 Fact Book
2017 vs. 2014 Dealers’ Surveys
The remainder of this report is based on the results of Farm Equipment’s most recent parts operations survey of North American dealers, which was conducted in May 2017. In many instances, the most recent results are compared with those from the 2014 survey. The 2017 study was more extensive than the first, and included questions about what dealers changed in their parts operations between 2014 and 2017, if anything.
A breakdown of dealers who participated in the study by the brand of equipment they represent, wholegoods sales dollar by customer type and number of employees working in the parts department is shown below.
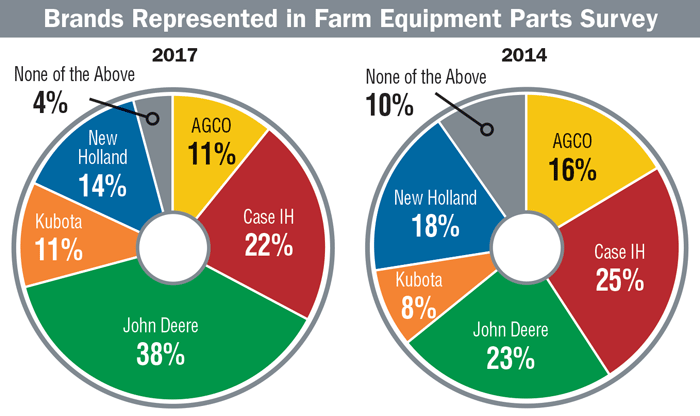
All of the major brands of farm equipment were represented in Farm Equipment’s recent parts operations survey. Case IH and John Deere dealers represented nearly one-half of all the survey participants.
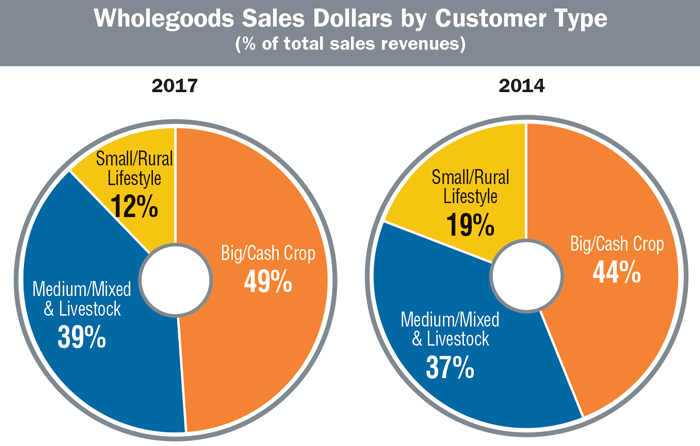
The customer base of the dealers participating in the parts survey represented a good cross section of the major end users of farm machinery and helped balance the overall results of the survey.
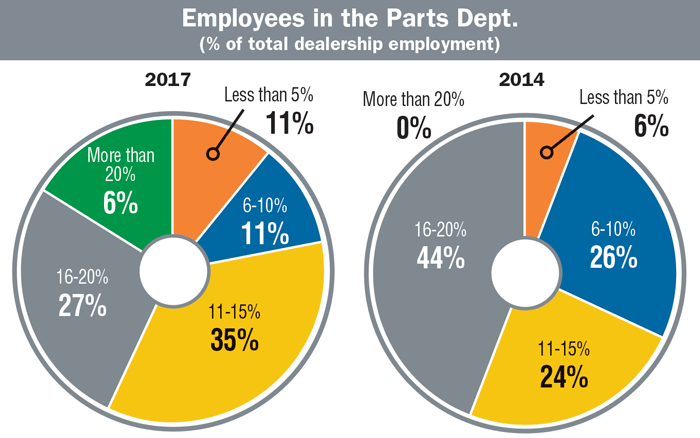
Nearly 70% of dealers indicated 11% or more of their employees work in the parts segment of their business. This would suggest parts are making a robust contribution to the business.
On average, dealers participating in the 2017 study say they gained some ground in their part sales during the past 3 years compared to the 2014 survey results. In the first study, 23% of dealers reported that part sales accounted for more than 20% of total dealership revenues (9% said 21-25%, 14% reported 26-30%). In the 2017 survey, 33% of dealers say parts sales made up 20% or more of dealership revenues (22% say 21-25%, 11% report 26-30%).
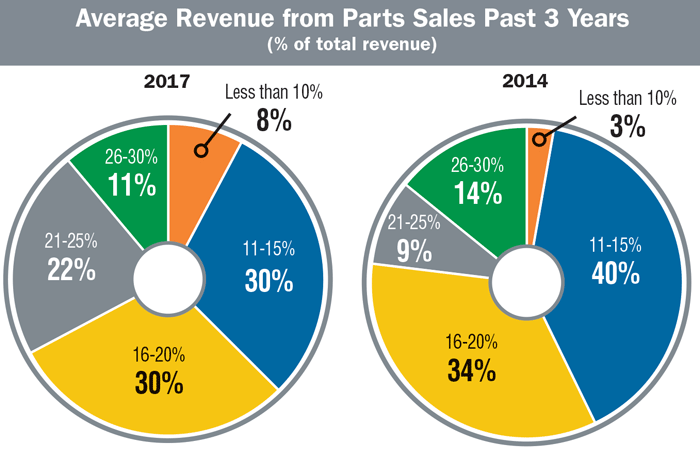
In 2017, 33% of North American dealers report 20% or more of their total revenue comes from parts sales. This is up 10 points from 2014 when just 23% of dealers reported 20% or more of their revenue was from parts.
On the lower end, 43% of dealers in 2014 reported 15% or less of total revenues came from parts sales. In 2017, this fell to 38% of dealers reporting 15% or less of revenue dollars were earned through the sales of parts.
Parts Productivity
Question: What is the estimated productivity of your parts department (annual $ parts sales per person, including part managers and support people) over the last 3 years?
Answer: $620,617/employee
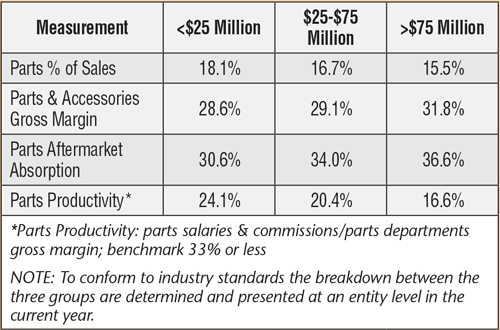
On average, in the most recent 2016 Cost of Doing Business study, dealers reported that 16.2% of total sales were the result of parts and accessory sales, up from 14.6% in 2015. For dealers with sales of less than $25 million, parts contributed a little over 18%. Of those with sales ranging between $25-$75 million, parts comprised 16.7% of total sales. But the largest dealers, where sales exceed $75 million, parts contributed only about 15.5% of total sales.
OEM vs. Non-OEM Sources
Where dealers get their parts has changed very little since the last Farm Equipment survey. Three years ago, dealers said 77% of their service and repair parts were new OEM sourced parts. This compares with 75% who replied in similar fashion to the 2017 survey. On average 17% of parts were new non-OEM sourced parts in 2017 vs. 18% in 2014. Only 5% of parts were rebuilt or salvaged, according to the results of the most recent survey and 4% were rebuilt or salvaged in 2014. Just 3% were “other” types of parts during the past 3 years and 1% fell into this category 3 years earlier.
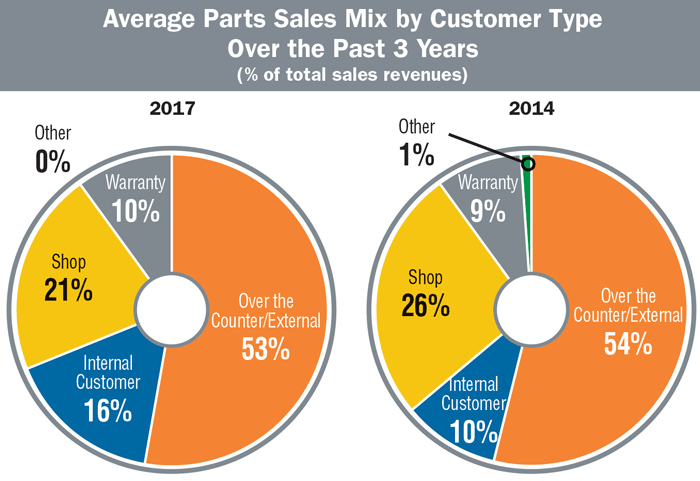
The 2017 survey data shows over half of part sales come over the counter from external customers, about even with 2014. Just over 20% originate from service business, and another 16% from internal customers.
About one-quarter of dealers report having changed their sources for parts in the past 3 years. The remaining 75% are using the same sources as they did in 2014.
According to the dealers who have switched parts suppliers in the past 3 years, price was the most important reason. Price was followed by parts availability, timeliness of shipping, parts quality and discount and incentive programs. At the bottom of the dealers’ list was ease of ordering.
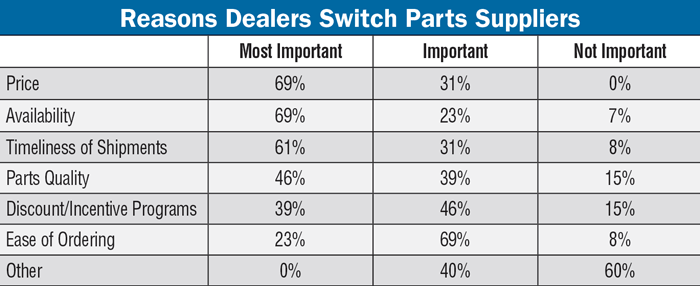
Price and availability were the top reasons dealers switched parts suppliers.
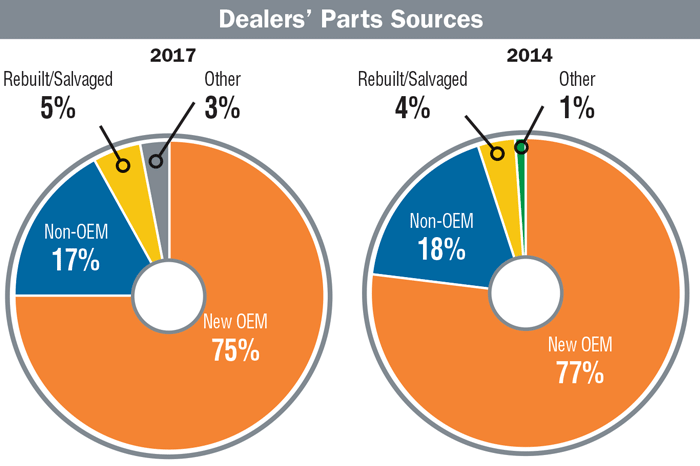
Three-fourths of dealers utilize new OEM parts in their operations; while 17% use non-OEM components. There was little change in dealers’ parts sources in the 2017 survey vs. 2014.
Where Parts Sales Originate
Where sales of parts come from showed some shifting between the 2017 study compared to the one 3 years earlier, but the largest group of customers stayed about the same. In 2014, 54% of dealers said parts sales came from external customers over the counter. This time around, that percentage fell by 1 point to 53%.
Parts Inventory Strategies for Different Equipment?
Question: Have you implemented different service parts inventory strategies for tractor parts vs. harvesting parts vs. tillage/planting parts?

The biggest change came in the areas of shop sales and over the counter internal customers (equipment set up and delivery, parts tied to wholegoods sales, etc.). In the 2014 study, dealers indicated that 26% of parts were sold to their service shop. This fell to 21% in 2017. Likewise, in the first survey dealers said only 10% of parts sales came from internal customers, but in the most recent study this grew to 16%. This may have occurred as dealers sought to spruce up used machinery in an effort to turn aged inventory.
In terms of parts used to meet warranty issues, the percentage of these parts sales only varied by 1 point, from 9% in 2014 to 10% in 2017.
Most experts in aftermarket sales agree that the best method of increasing parts sales is by increasing sales of service. John Walker, a long time industry consultant specializing in aftermarket operations, is fond of quoting Stuart MacKay, who said, “The dealer who turns the wrenches on the equipment is guaranteed the parts business.”
Internal vs. External Customers
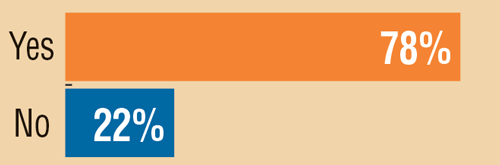
As for dealers charging internal customers at the same rate as external customer parts, more than three-quarters of dealer (76%) report no difference regardless of where the sale originates. The remaining 24% say the rate for internal vs. external customers is different.
This same question in 2014 showed only 63% of dealers charged internal and external customers at the same rate, while 37% said the rate charged for parts varied between these customers.
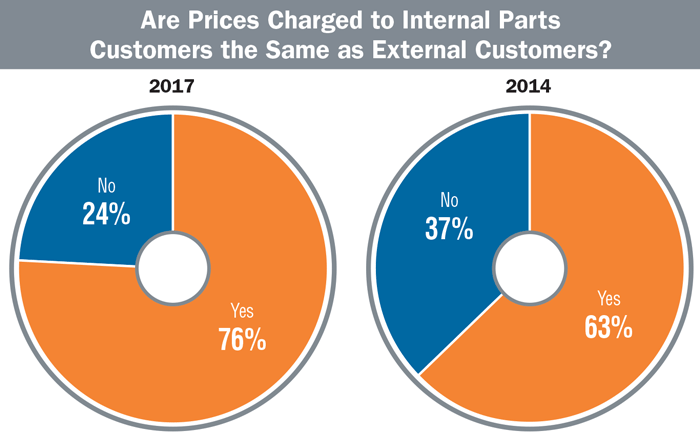
More than 75% of dealers participating in the survey indicate there is no difference between what they charge internal customers for parts compared with their external customers. This is up from 63% in the 2014 survey.
As for gross margins earned between customers, there is virtually no difference from the 2014 study and that done in 2017. Three years ago, 70% of dealers responded that they earned about the same gross margin on parts sales to their shop and those for over the counter external customers. In 2017, this percentage varied by only 1 point, with 71% of dealers saying the gross margins were about the same.
Otherwise, the percentages stayed the same for those charging 1 point less (7%) and 1-2 points less (11%) in both studies. Those charging 3 points less for over the counter parts vs. shop parts changed by only 1%, with 11% of dealers reporting this difference in 2017 vs. 12% in 2014.
Margins: Little or No Change
Likewise, comparing gross margins earned on their major OEM’s parts compared to margins on shortline parts showed little variation in 2017 vs. the study in 2014. Regardless of parts supplier, gross margins decreased slightly but stayed at a healthy level of 30% or higher.
In the 2017 survey, dealers indicated that the average gross margins achieved on their major line OEM parts were 31.5%. This compares with a 32.5% margin in 2014. As for their shortline parts, dealers report they earned average margins of 32.1% in 2014, which slipped to 30.4% in 2017.
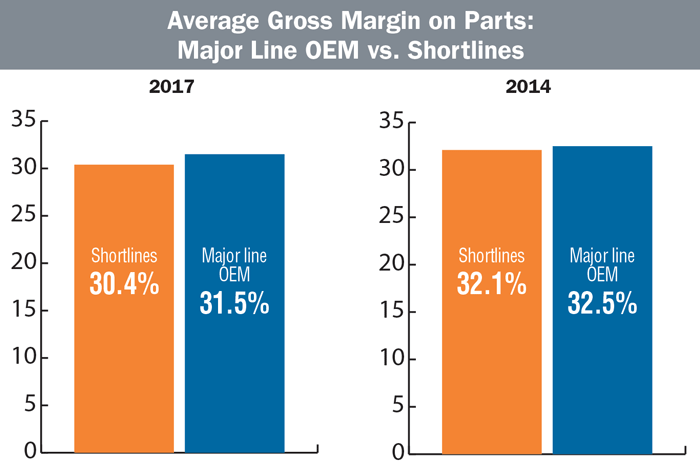
Similar to the 2014 results, dealers report very little difference in the gross margins earned from the sale of parts from their major OEM compared to that earned from the sale of parts supplied by their shortline manufacturers.
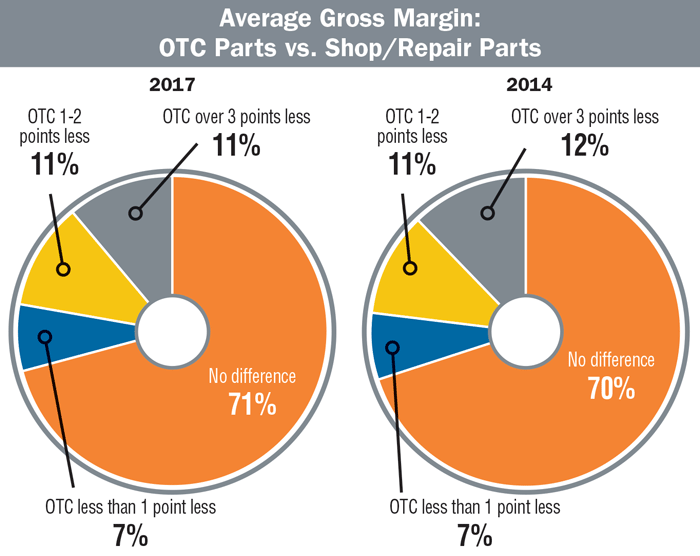
Much like in 2014, survey data showed for 71% of dealers there’s no difference between the gross margin earned on parts purchased by over the counter (OTC) external customers and those utilized in the dealership’s service department.
As George Russell of the Machinery Advisors Consortium commented in the 2014 report, “This is very good because the range should be 30-35%. There are dealers who complain that the manufacturer and inline competition doesn’t allow them to get over 30%. That’s not what this survey says. It demonstrates that, overall, dealers are right about in the middle of the range of where they ought to be. And, keep in mind; this is an average, so half the dealers are above this number.”
OEM Performance
Question: Are the OEMs able to supply service parts to your dealership in the timeframes and quantities required?
When it comes to comparing gross margins earned from their major line OEM to those of their shortline suppliers, 40% of dealers in the 2017 study said they were able to get higher margins from their majors. Some 46% said their shortline suppliers provided them with higher margins on parts. The remaining 14% of dealers said the margins were about the same between their majors and their shortlines.
The range of margins ran from a high of 40% to a low of 24% from the sale of major line parts. The span of gross margins earned from shortline parts ran from a high of 42% to a low of 21%.
Generally, the gross margins earned by dealers responding to Farm Equipment’s 2017 parts operations study were somewhat higher than those in the last Cost of Doing Business study. According to the 2016 study, on average, dealers earned a 30.6% margin on part sales, which was up from a 29.4% gross margin in the 2015 report.
Other Critical Metrics
Measuring several other metrics that are revealing of a dealership’s parts operations is vital to the overall performance of farm equipment retailers. Among these are parts turns, customer fill rates and parts absorption rate. Another that experts insist is also critical is tracking lost parts sales, as this measure tends to work hand in hand with parts turns and fill rate, and also impacts absorption.
The number of times inventory is turned over impacts most major financial measures monitored by a dealership (return on equity, return on assets, etc.). The industry benchmark for all dealer inventory is 2.5-3 times.
Parts turns are no less important. On average, dealers who participated in the 2017 survey indicated their parts turns were 2.2 times. This is down slightly from the 2.3 turns dealers reported 3 years earlier. Despite the slippage, dealers were also asked if their parts turn had improved compared to 3 years ago. Overall, 40% said “yes,” 23% said “no” and the remaining 37% said their parts turns in 2017 vs. 2014 are “about the same.”
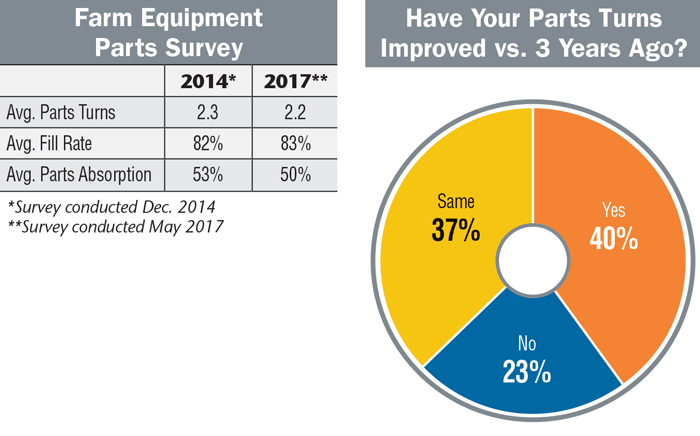
While 40% of dealers say their parts turns have improved vs. 3 years ago, 37% say they’re about the same.
Dealers were also asked if they had a “stated target” for parts turns. While 81% have a goal they work toward, 19% said they had not set a specific goal for the turnover of parts. Of those dealers who report having a goal for the number of turns they are aiming at, the average number of turns is 2.6 times.
Another critical metric measured by dealers includes the fill rate. This is defined as the percentage of customer demands that are met through immediate parts availability, without back orders or lost sales.
Parts Performance by Sales Volume
The annual Cost of Doing Business Studies contain several important measurements for how North American farm equipment dealers are doing when it comes to their parts operations. Several of these are presented here by sales volume.
Equipment Dealer Consulting, P.C., the certified public accounting group affiliated with the Western Equipment Dealers Assn. (WEDA), conducted the 2016 CODB study. Working in concert with various state and regional equipment dealer associations, WEDA compiled survey responses from 230 dealers who operate more than 600 store locations in the U.S. and Canada. Call Lonnie Finch, CPA, at 800-762-5616 with questions or to learn how to access the survey results.
Dealers responding to the recent parts operations survey report an average fill rate of 83%. This is up from 82% in 2014. Bob Clements of Bob Clements International, says that most dealers are in the mid-80s, though he urges dealers to strive for the low 90s.
Parts absorption usually represents a larger portion of a dealers’ overall aftermarket absorption rate. According to the dealers participating in the 2017 parts operations survey, they averaged a 50% parts absorption during the past 3 years. This is down from the 53% level reported 3 years earlier.
Comments offered by Russell on these critical measures in the first report bear repeating here. “The art of the parts business is balancing your inventory turns with your fill rate. Ideally, we would like to see turns between 2.5 and 3.5. Inventory turns are critical, especially when the industry slows down and a dealership’s need for cashflow increases. Of course turns will vary depending on the customer base and seasonality.”
He calls an average fill rate of 83% “pretty good,” but adds, “The discussion I would have around this is what is the fill rate for stocking parts? In other words, what is it for the parts that a customer expects you to have. He doesn’t expect you to have everything, but this number indicates that 17-18% of the time, the customer doesn’t leave with what he wanted.
“So it could be better,” he says. “It’s about balancing fill rate and the dealer’s need for cash with overall customer satisfaction.”
To improve these metrics, Russell says, the dealership must track lost part sales and develop a history to ensure it will have the right parts on hand in the right quantity.
The 2017 survey revealed that dealers are doing a much better job of this than they did 3 years ago when about 55% of dealers “kind of sort of” tracked lost parts sales. That is, 21% said “yes” they did track lost part sales, while another 34% said the “mostly” tracked them.
This time around, the percentage of dealers who “definitely” or “mostly” tracked lost part sales jumped to 86% — 44% said “yes” and 42% said “mostly yes.” Of the remaining dealers, 6% say they “rarely” track lost parts sales (vs. 38% in 2014) and 8% indicate they do not track this metric (vs. 7% in 2014).
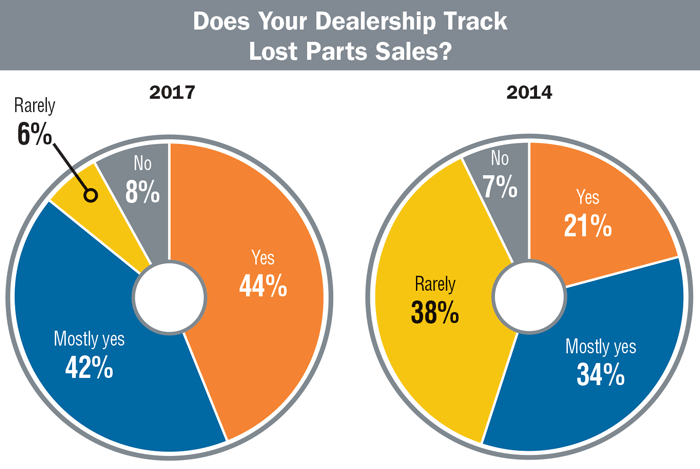
Up significantly from the 2014 survey, 86% of dealers track lost part sales. By developing a history of lost sales that identifies which parts were not available, dealers can improve the overall metrics of their parts operations.
According to Russell, staying on top of this measurement “usually requires systems that the most sophisticated manufacturers have to help the dealer order parts automatically. It takes a lot of discipline.”
Regarding absorption, Russell says, the 53% level indicates parts are a significant contributor to covering dealership expenses. At the same time, it can also reflect how well expenses are kept in check.
Where Are We? Where Are We Headed?
Compared to where they were 3 years ago, North American farm equipment dealers have made some progress in improving the profitability of their parts operations. Probably not as much as they had aimed for and hoped to achieve. There’s little doubt that many, if not most, dealers have sharpened their focus on their aftermarket business. At the same time, a lot has changed in the past few years. More have become larger, multi-store dealerships, which has changed they way they operate as an organization. In the parts segment, internet shopping by farmers has increased competition for dealers.
If nothing else, dealers have managed to maintain pretty good margins for parts, but it’s difficult to determine if the industry has reached its full potential for parts revenue. This will be determined only by dealers’ efforts to ensure their aftermarket business remains a focal point for everyone in their organization.
To reiterate the concluding message from the 2014 report, the parts business will not grow by sitting and waiting for it to walk in the dealership’s doors. Russell says,“Dealers need to go after parts sales. It’s not just the farmer’s initiative that will grow this business. It’s something that can be effectively promoted and increased, especially by growing the service labor business. The shop needs to be a big seller of parts.
More Changes to Come for Parts Departments
The final question of the 32-question survey was “What changes is the dealership planning in the next 18 months to improve overall efficiency and/or increase sales and profitability of the parts department?” Following are just “some” of the changes that dealers say they’re planning to make to improve the performance of their parts department.
- “We’re adding an outside sales rep for parts.”
- “We will get better at taking online orders and shipping.”
- “Expanding our expediting to include more aftermarket sales to better serve our customers.”
- “Adding a TV screen with parts specials rotating.”
- “Building a new store, to help with space and efficiency. We are continuing with training staff, more knowledge and correct orders creates more efficiencies and better margins. We also are working with Deere to maximize all programs, as well as with non-Deere vendors.”
- “We’re putting more people on the parts counter.”
- “We are adding a parts road salesman (PSSR) and marketing parts online.”
- “We are planning to renovate the parts showroom during the next few years.” “We’re adding online sales.”
- “We will be doing more on-site visits from managers.”
- “We are upgrading our barcode system, upgrading personnel, adding a call center and adding more attachment/optimization packages.”
- “Hopefully we’ll add new cabinets, new look to make place more inviting.”
- “Reduce old parts, watch metrics closer and expand our parts offering.”
Additional Coverage