Have you ever wondered what the “new normal” means? I think it’s another way of saying that things are heading south, back to some level that was considered “normal” at some point in time. Most of the time when I’ve heard the term used, it’s based on anecdotal evidence, which I find interesting. At the same time, I think being able to put some numbers behind it gives terms like the “new normal” a lot more credibility.
This is why I found an article in the Spring 2017 issue of Iowa State University’s Center for Agricultural and Rural Development (CARD) newsletter interesting. Entitled, “Four Reasons Why We Aren’t Likely to See a Replay of the 1980s’ Farm Crisis,” Iowa State ag economist Wendong Zhang, outlines “four economic and legal reasons why this farm downturn is unlikely to slide into a sudden collapse of agricultural markets.
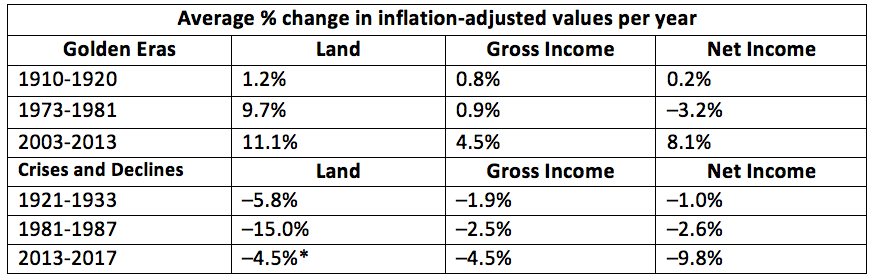
You can read the entire article here, but speaking of numbers, I found the average percentage change in land, gross income and net income that Zhang helpful in understanding the major influencers of both the good times for ag and those not-so-good times.
In examining the numbers in the table below, it’s plain to see what an impact land values had on the general health and welfare of the industry. For example, in the “Golden Era” of 1973-81, the value of land rose by nearly 10%. A drop of 15% followed this between 1981-87, a period Zhang calls “Crises and Declines.” That’s a swing of nearly 25%. Since land is easily the biggest line item on most farmers’ balance sheets, you can see how this affected producers’ ability to borrow.
Of course, anecdotally, this doesn’t tell the whole story, which included how speculation led to that run up in farmland prices in the first place. It wasn’t commodity prices, which is largely the cause of our current downturn. Between 1973-81, the average price for a bushel of corn was $2.46. Between 1981-87, the average price was $2.48 a bushel. On average, it was only a 2 cents per bushel difference between the boom and bust of the 1970s and ‘80s.
It also doesn’t take into consideration the speed in the rise and fall of commodity prices. In the “Golden Era” of 1973-1981, it took 8 years for a bushel of corn to rise $1.03 ($1.89 in 1973 and $2.92 in 1981). But during the “Crises and Decline” period of 1981-87, the average price for a bushel of corn fell by nearly one-half within 3 years ($3.02 in 1984 and $1.56 in 1987).
So, back to the question: What does “normal” actually mean? As Zhang points out, “Despite the deteriorating agricultural financial conditions and continued decline in farm income, the current farm downturn is more likely a liquidity and working capital problem, as opposed to a solvency and balance sheet problem for the entire agricultural sector. Rather than an abrupt farm crisis, we are likely experiencing a gradual, drawn-out downward adjustment to the historical normal return levels for the agricultural economy.”
In other words, today’s “normal” is kind of different than yesterday’s “normal” and tomorrow’s “normal” will probably be different than today’s “normal.” So once you figure out what “normal” actually means, please let the rest of us know.