North American dealers reported strong financial results for 2022, according to the results of the 2023 Cost of Doing Business study from the North American Equipment Dealers Assn. (NAEDA).
The 2023 study covers responding dealers’ metrics from 2022, and averages are reported on a location basis. The results were analyzed in a Farm Equipment webinar by Curt Kleoppel, NAEDA’s CFO, and Dealer Institute Instructor Trent Hummel, who broke down the nuisances of the data for dealers.

Participating dealers had from May until August 2023 to submit their data. Other associations who worked with their dealer members to contribute data for the 2023 report include the Deep Southern Equipment Dealers Assn. and the Northeast Equipment Dealers Assn. Dealers who are interested in the full report and the region specific results can order them through their regional association.
For this report, the “over $150 million revenue” category was changed to $150-$350 million, with a fourth “over $350 million” category added. This new category was not included in category breakdowns for lack of comparable data but was included in North American averages.
The average locations per participating dealership fell for the first time in several years to 7.2 vs. 7.4 in the previous report.
“We’ll be seeing that number of locations change in the next report,” Kleoppel says. “I know there was a lot of activity in 2023 with 6-7 location stores merging together. And there were several 8-9 location acquisitions that happened in 2023. We’ll probably see that average location per dealership organization be about 10 or 11 possibly next year.”
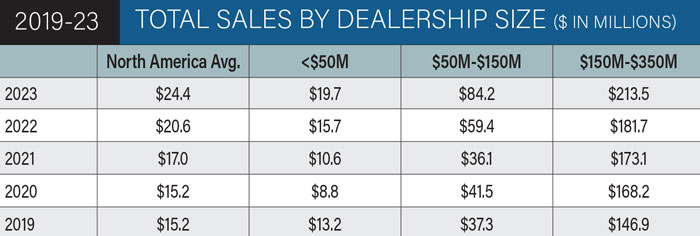
Dealers reported an average of $24.4 million in revenue per location, up 18.5% from $20.6 million per location in the previous report. New wholegoods revenue was $12.1 million per location in 2022, up 17.5% year-over-year from the previous report. Service revenue per location was the largest year-over-year increase, up 25.2% year-over-year to $1.5 million.
“The new and used wholegoods numbers would’ve been higher if we would’ve had the inventory to sell,” Hummel says. “We just didn’t have it. It would’ve probably been right up there with the parts of service increase, above 20% for each of those categories.
“It’s good to have the parts and service growing more than wholegoods. That’s where your higher margin dollars are. That’s real cashflow.”
Dealers in all sales volume categories saw year-over-year increases in their sales for 2022, with dealers in the $50-$150 million category reporting the largest year-over-year increase of 41.8% to $84.2 million. Though dealers in the largest sales volume category ($150-$350 million) once again reported the smallest year-over-year increase at +17.5%, they were also the only sales volume category to see year-over-year sales increases in each of the last 5 years.
Assets & Equity
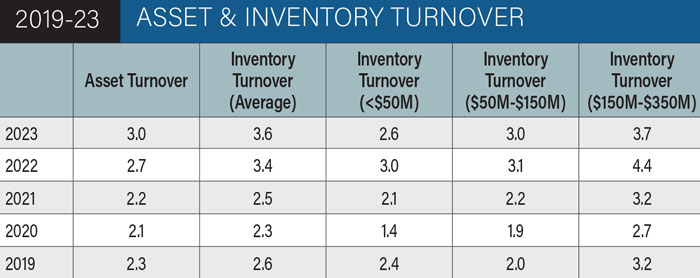
Asset turnover reached 3 in the latest report, up 11.1% year-over-year and a 5-year high. Inventory turnover also rose, up 5.9% to 3.6 and another 5-year high.
“This has been going in the right direction for 5 years, and I hope for the next 5 years we can keep this going up,” says Hummel. “My biggest Achilles heel is too much inventory, not turning it fast enough. Then we’re just sucking all the cash out of the dealership, parking it in used inventory.”
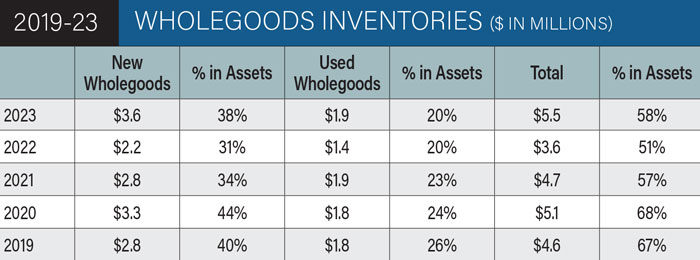
Dealers reported their inventory was up for both new and used wholegoods in 2022, with the average per location new wholegoods coming in at $3.6 million (up 63.6% year-over-year) and used wholegoods coming in at $1.9 million (up 35.7%). This put both new and used inventory levels at or tying 5-year highs. The percentage of wholegoods in dealers’ assets rose to 38% for new and remained unchanged for used at 20%.
“The way inventory is going, it’s starting to accumulate a little bit more in 2023, but I think it’s at a pace that can create more turns going forward,” Kleoppel says. “And if you look at the ‘over $350 million’ category, as far as the percent of assets for new and used equipment, they were at 59.5%, just a little bit more than the North American average.”
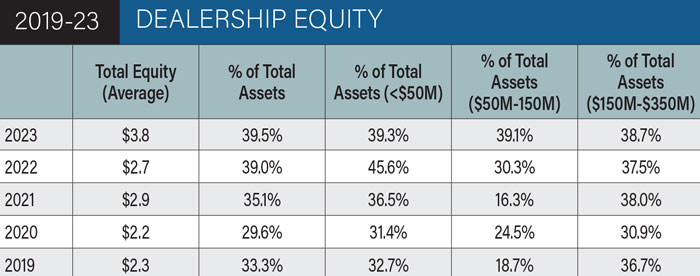
After dropping to $2.7 million in the previous study, dealers’ average total equity per location jumped to $3.8 million in the latest study, a 40.7% year-over-year increase. At the same time, the percentage of dealers’ equity as their total assets rose to a 5-year high of 39.5%. Dealers with under $50 million in sales volume reported the highest percentage of their total equity in assets at 39.3%, down from 45.6% in the previous report.
“It’s great to have lots of high equity in the dealership, but what is that equity?” Hummel says. “Is it cash? That’s great if it’s cash, but when you have too much cash or too much cashflow, sometimes dealers get sloppy in operations. I don’t want to say you want to run yourself thin on cash, but too much makes you lazy.”
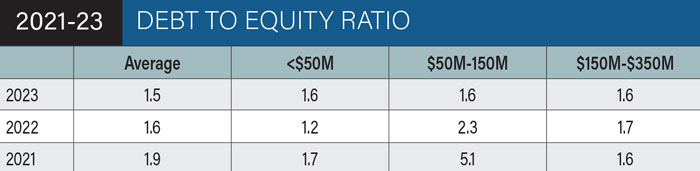
The average debt to equity ratio per dealership location dropped to 1.5 from 1.6 in the previous study, with dealers in the mid-range showing another sizable drop from 2.3 to 1.6. NAEDA’s target for dealers is a ratio of 3.3 or less.
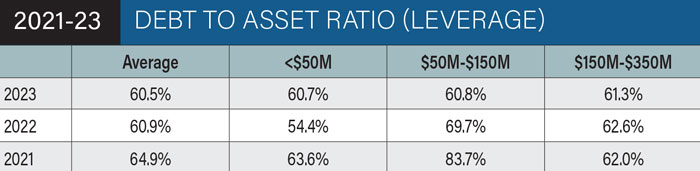
The average dealer location debt to asset ratio fell from 60.9% to 60.5% in the latest study, well below the industry target of 80% or less. Dealers in the lowest sales volume range showed the smallest average ratio of 60.7%, though this was up from 54.4% in the previous study.
Sales & Margins
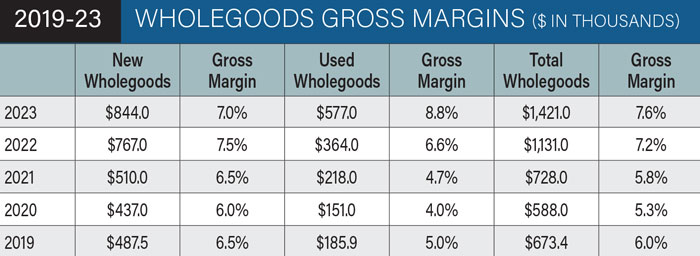
Both new and used wholegoods gross margins reached 5-year highs in the most recent report, with the new wholegoods average coming in at $844,000. That represented a 10% year-over-year increase, below the 58.5% increase that put average used wholegoods gross margins at $577,000. Average new wholegoods margin as a percentage dropped slightly to 7% but rose on the used side to 8.8%.
“If you’re doing a lot of used equipment, your new equipment gross margin should be lower than your used equipment margin,” Hummel says. “It’s just a healthy way to run the business. Of course every store’s a little different, but if you’re taking a lot of used equipment on trade, your margins on new should be lower than used. And here we hit a home run this year with it.
“Now part of it is because if a guy wanted to buy a tractor in 2022, his best deal was the one that he was looking at right then. If he waited half an hour, he was going to miss that tractor. He had to buy it right then, and he had to pay the margin, whatever the dealer was asking.”
Dealers’ per location parts sales averaged over $3.6 million in 2022, up 21.9% year-over-year. At the same time, the percentage of dealer location sales generated by parts revenue rose slightly to 14.9%, the second-lowest percentage in the last 5 years. NAEDA targets parts to be over 20% of the store mix.
“I know our target is +20%, but it’s going to be very hard to hit when the price of new iron is so high,” says Hummel. “As these big ticket items get to be $1 million, it’s going to be hard.”
Average parts gross margins were up 34.1% year-over-year in the latest report to $1.3 million while average margins rebounded to 34.3% after falling to 31.2% in the previous report. This put the average percentage above the target of over 32%.
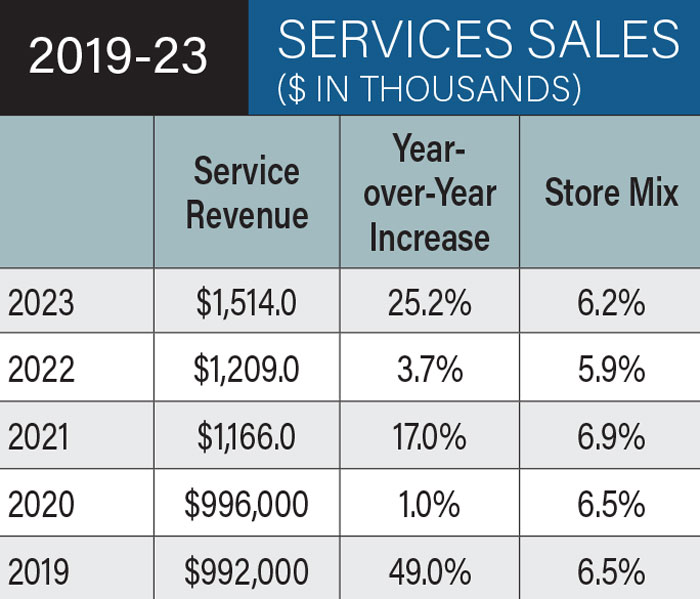
Service revenue was also up year-over-year, increasing 25.2% to $1,514,000 per location. Store mix was also up to 6.2%.
“When a guy brings his machine in and there’s an $18,000 work order, in the old days, he might whittle it down to $14,000 and say, ‘Don’t fix this, don’t fix that,’” Hummel says. “Well, he didn’t do that in 2022, he just said, ‘Fix it all.’ He had the cashflow. A lot of this is because guys would spend the money, they had it.”
How to Get & Use the Cost of Doing Business Study
To bring the information in the Cost of Doing Business Study closer to home, it’s suggested dealers order the Cost of Doing Business report for their region. It is also available by sales volume and broken down for stores with $50 million or less, $50-$150 million, $150-$350 million and over $350 million in annual sales. Dealers who participate in the study can get a free copy of the report from the regional association. Non-participating dealers can purchase the results from their regional groups.
For questions or to learn how to access the survey results, please contact Lonnie Finch, DPA, Equipment Dealer Consulting LLC at 800-762-5616 or email him at lfinch@naeda.com.
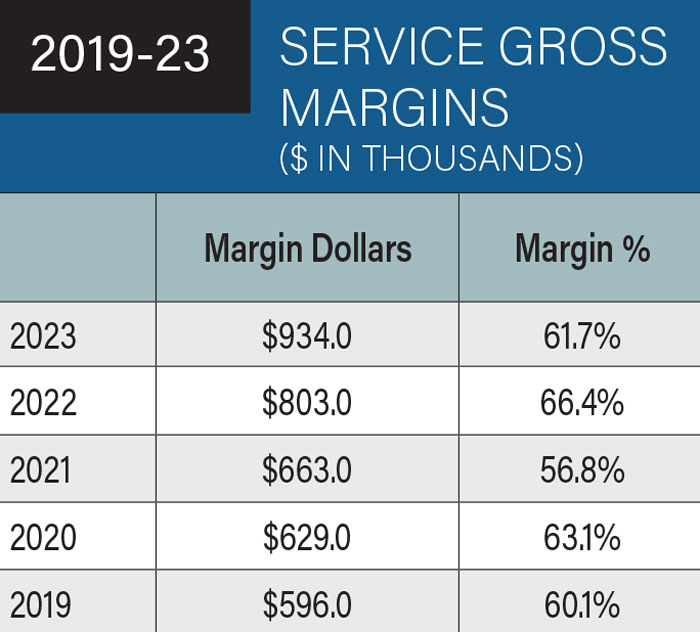
Average dealer location service margin dollars hit a 5-year high at $934,000 in the most recent report, though the average margin dropped to 61.7%.
Expenses & Profits
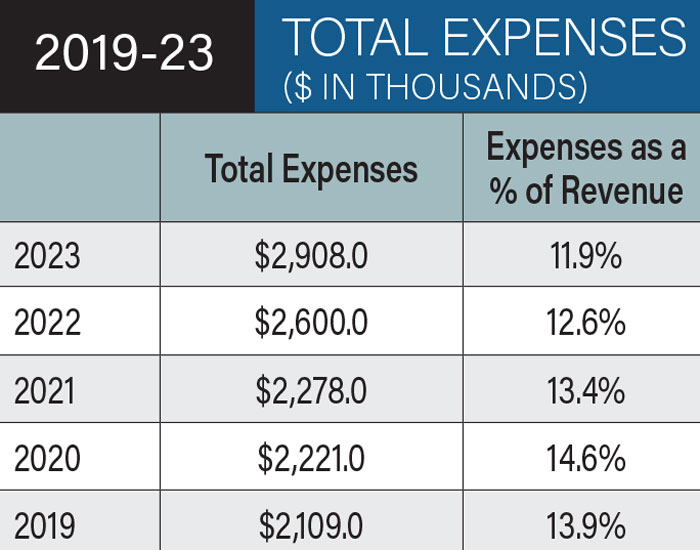
Dealers’ average per location total expenses was another metric to hit a 5-year high, coming in at $2.9 million per location. Dealers’ expenses as a percentage of their revenue, however, dropped to a 5-year low for the second year in a row to 11.9%.

“Anytime I go into a dealership and I look at their expenses as a percent of revenue, if it’s under 10%, without knowing anything else I know they’re making money,” says Hummel.
Average per location profit from operations rose for the third year in a row, up 66.9% to $1.3 million. Profit as a percentage of revenue was up in all 3 dealer revenue categories, with dealers in the $150-$350 million category reporting the highest percentage at 5.3%.
“In 2019, we were at $335,000 and now we’re at 1.2 million,” Hummel says. “We’ve done very well the last 5 years at cleaning up things and getting ourselves in position to make some money. Probably changed some processes, some procedures and got some people in place.”
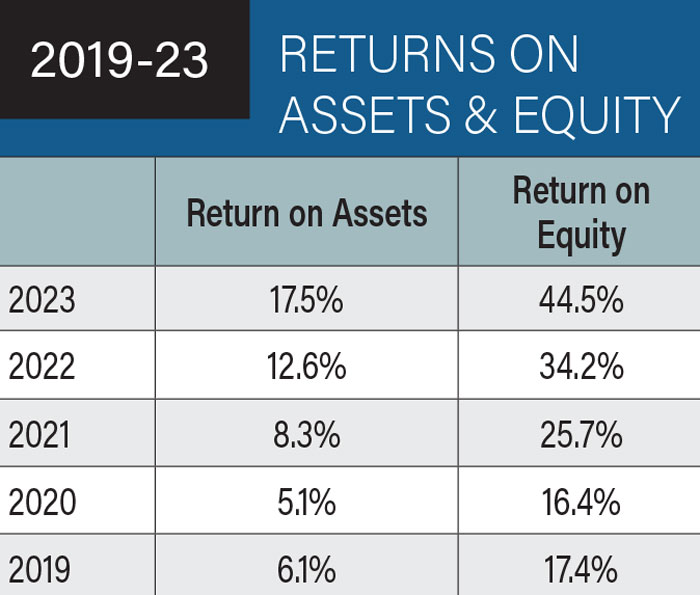
Return on assets and return on equity both hit new highs for dealers in the most recent report, with return on equity in particular jumping over 10 percentage points to a 44.5% return.
Employees
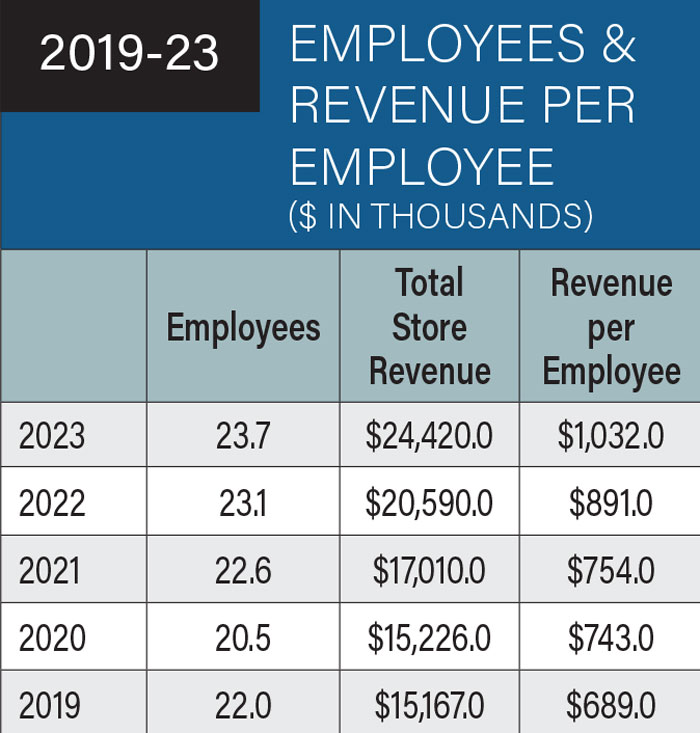
For the third year in a row, the average number of employees per dealer location rose to 23.7, bringing the average revenue per employee to $1 million (up 15.8% year-over-year). NAEDA’s goal for dealers is for roughly $1 million per employee.
“Depending on what your store sells, you might not be aiming for $1 million,” says Hummel. “Sometimes it might only be $750,000. If you’re a Canadian dealer in the big iron business, you might be at $1.3-$1.4 million because that equipment is so expensive and you’re selling so much of it.”
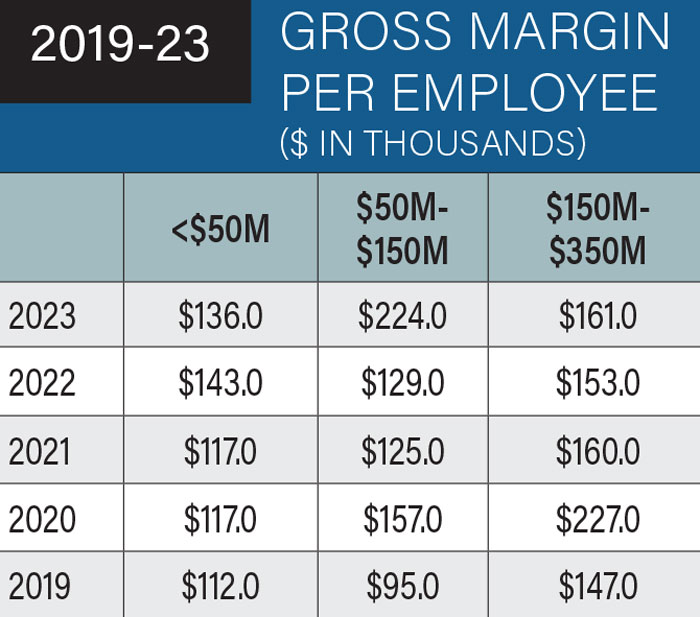
Gross margin dollars per employee was up for the medium-sized and larger dealerships, but down slightly for the smaller ones. Dealers in the $50-$150 million category saw the largest year-over-year increase, up 73.6% to $224,000 per employee.
“When we presented this report in 2019, I really pointed out those $50-$150 million dealers, if they didn’t pull up their socks, they were going to run into trouble,” Hummel says. “Well, they have cleaned up their act. They’ve gone from $95,000 to $224,000. This is tremendous. They’ve figured out how to run a 3-6 store operation. They were running it like a 1-2 store operation. They’ve figured out how to take advantage of the synergies and the processes and the people they have.”

Overall parts and service absorption rose in the most recent study from 66.6% to 75%, though, by category, only the largest dealers showed an increase. Those dealers saw their absorption jump year-over-year from 66.3% to 74.5%. Dealers in the new over $350 million category hit 82.7% absorption in 2022.
“We’re working on getting better,” Hummel says. “It’s just going up. This is looking positive. We’ve been preaching on this for 30 years, probably. This is how we pay our bills in the store. When wholegoods has a soft year, parts and service can pay all the expenses.”