According to the results of the 2020 Cost of Doing Business study from the Western Equipment Dealers Assn., dealers are doing well according to several key financial metrics, including increased aftermarket gross margins and increased revenue per employee. However, there are other areas that will need attention going into 2021, such as declining wholegoods gross margins, lowered return on assets and equity and a drop in profits.
The 2020 study covers responding dealers’ metrics from 2019, and averages are reported on a location basis. Results from Canadian dealers were converted to USD. The results were analyzed in a recent Farm Equipment webinar by Trent Hummel and Curt Kleoppel, CPA, CVA, who dove into what the study’s findings could mean for dealerships in 2021.
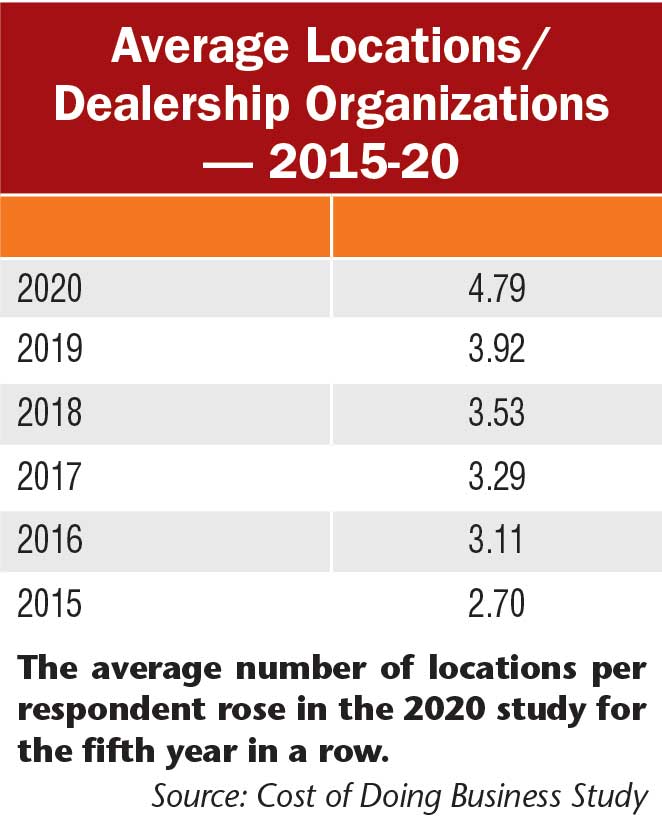
Dealers reported continued consolidation in the latest study for the fifth year in a row. In the 2020 study, the average respondent had 4.79 locations, up from 3.92 in the 2019 study and 3.53 in the 2018 study. Kleoppel mentions seeing consolidation continuing to increase in the coming years, saying, “The way 2020 is going, you’re going to see that number be even higher in the next study. I’ve been seeing more organizations with 10-20 locations merge with other organizations with at least 6 locations. So that number is probably going to go up quite a bit next year.”
Revenue Flat Year-Over-Year
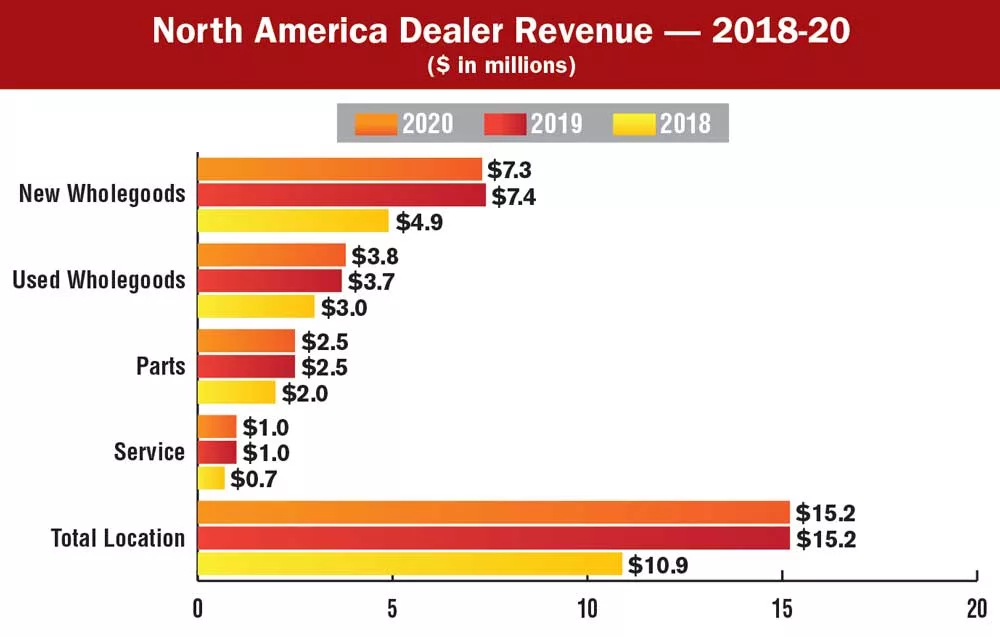
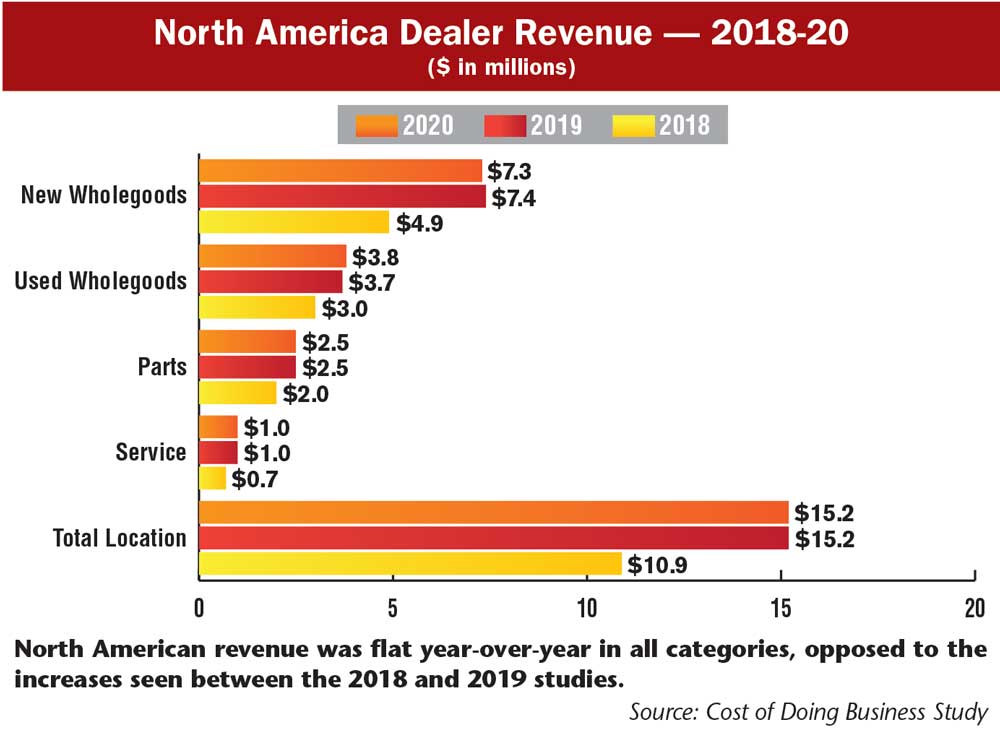
Total average revenue by location in the 2020 study was $15,226,000, mostly unchanged from $15,167,000 in revenue per location in the previous study. This is noticeably different from the change between the 2019 and 2018 study, which saw a 39.5% jump from $10,872,000 to $15,167,000. Hummel says this might be from a change in the demographic of survey respondents.
“With the big jump between the 2018 and the 2019 studies, there had to be an increase in participating high-volume dealerships,” he says. “Now, the 2019 and 2020 studies were very similar, so we assume many dealers who reported in 2019 also reported in 2020.”
Despite the lack of change between the 2019 and 2020 North American average revenues, Hummel sees it as a positive trend considering some of the challenges dealers faced in 2019. “The 2020 study’s revenue numbers are actually fairly promising, as many dealerships reported lackluster sales in 2019,” he says. “They were dumping units due to minimal retail activity.”
Between the 2020 and the 2019 study, new wholegoods sales dipped 1.7% to $7,319,000, while used wholegoods sales increased slightly to $3,796,000. Parts revenue per location was up 3.3% to $2,548,000, and service revenue was flat at $996,000.
Inventory, Asset Turnover Down Slightly
Average turnover rates also dropped in the most recent study. The average asset turnover was 2.13, down from 2.35 in the 2019 study but up from the 1.72 turns in the 2018 study. Parts and wholegoods turns also saw a slight decline, going from 2.37 in the 2019 study to 2.29 in the 2020 study. Though he admits it’s a difficult metric to breakdown, Hummel points out that the changing industry “goals” on turns have also made this a tricky dataset to analyze.
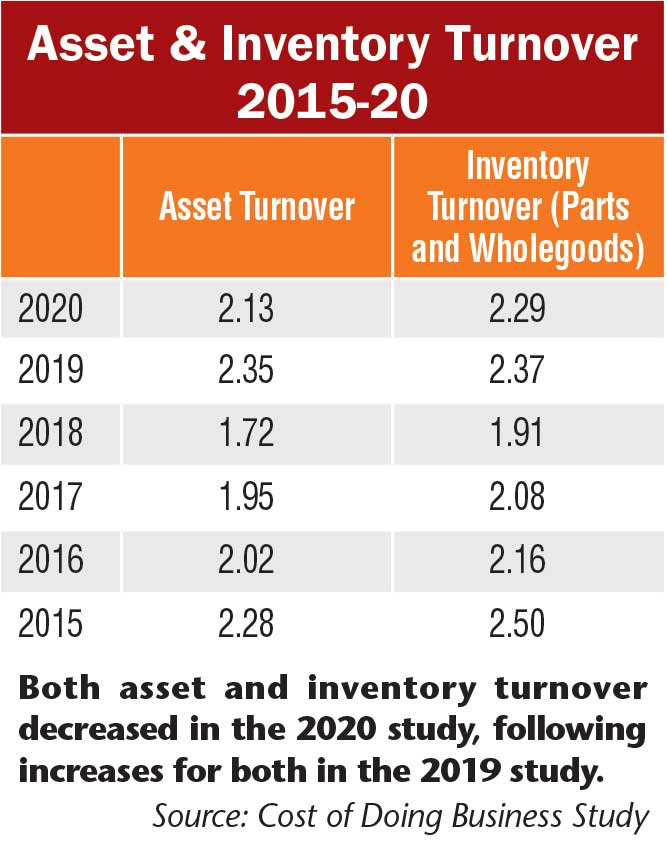
“We prefer to separate parts and wholegoods turnover, but it’s tallied together for the 2020 report,” he says. “We put a question mark beside the target for inventory turns because I have some dealers telling me they’ll never get higher than 2 turns in wholegoods. Then we have other dealers indicate they’ll never do less than 4 turns.”
Kleoppel points out that with a goal of 4 or more turns in parts, it can throw off the results in the average inventory turnover, which incorporates both parts and wholegoods. These two metrics may be separated in future studies, he says.
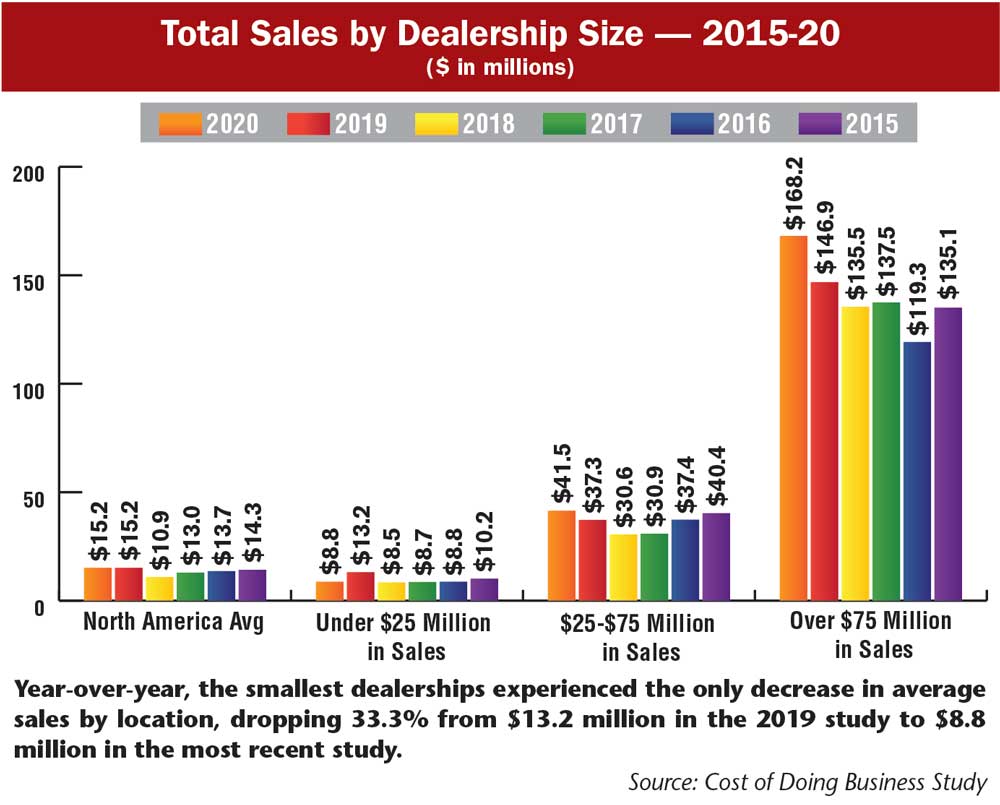
When breaking down inventory turns by volume of dealership sales (under $25 million, $25-$75 million and over $75 million), there were noticeable differences between the smaller and larger dealerships. Among dealers in the under $25 million category, average inventory turns fell from 2.01 in the 2019 study to 1.35 in the 2020 study. However, dealers in the $25-$75 million category saw an increase from 1.63 to 1.85 and those in the over $75 million category rose from 2.37 to 2.66. Hummel sees this as a testament to the successes of larger dealership groups.
“Eight years ago, we all talked about these big complexes, asking if they’ll make it through a downturn,” he says. “We’ve just had 5 years of not very good, not very active business, and their turns have improved. The big complexes have figured it out. They’re going to be a contender and they’re not going away.
“I hear some dealers say, ‘That dealership will never survive, they’re never going to stay afloat.’ Well, the over $75 million complexes have double the turns as the under $25 million dealerships have, and they’re doing a better job managing their balances. We don’t believe the large complexes are going to collapse.”
Wholegoods Inventories Up
When it comes to wholegoods inventories, respondents reported an average $5,047,000 in total inventory, up 9.5% from an average of $4,608,789 in the previous study. This is the highest average total inventory reported in the last 6 years. The average dealership had 68% of its assets in wholegoods, up from 67% in the 2019 study and 63% in 2018. Hummel considers 67% within a reasonable range but cautions dealers to remain aware of this metric.
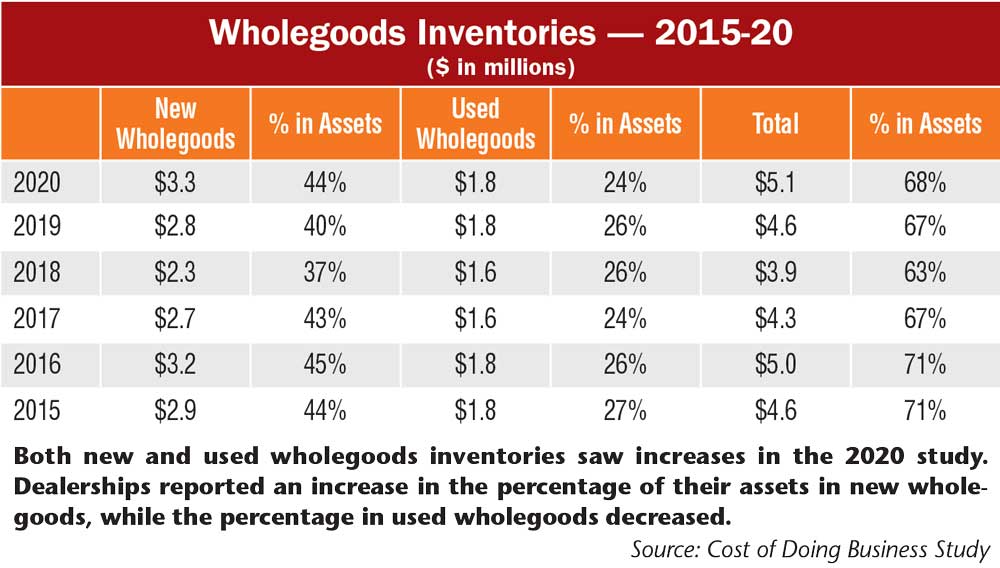
“This is a metric dealerships don’t monitor often enough,” he says. “They should be calculating how much of their total assets are in wholegoods inventory. They need to keep it below 65%, or better yet 60% if they can. Then they are not taking big chances by carrying too much inventory.
The average new wholegoods inventory was $3,270,000, up 17.2% from $2,790,993 in the 2019 study. The average percentage of total assets also rose to 44% for new wholegoods vs. 40% in the 2019 study and 37% in the 2018 study.
Used inventories were down with the average dealership location reporting $1,778,000 in used wholegoods, down 2.2% from $1,817,795 in the previous study. The average percentage of used wholegoods also dropped to 24% from 26% in the previous study.
Dealers Face Lower Equity
Dealership equity took a hit in the most recent study. Total equity was $2,192,000 on average, down 4.7% from $2,298,957 in the previous study. As a percentage of total assets, equity made up 29.6% in the most recent study, down from 33.3% in the 2019 study. Kleoppel points out that the larger dealerships took the biggest hit in this category.
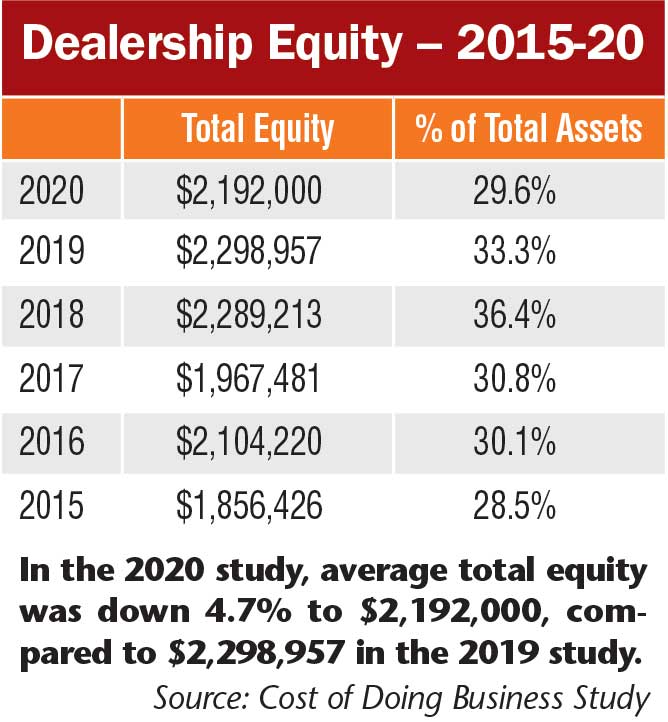
“The biggest drop we saw was among the high-volume dealers,” he says. “They dropped almost 3-4% from a year ago. I think part of it is the little bit of increase in inventory, which would cause more increase in payables and a decrease in equity.”
Hummel adds that overpriced used inventory may have played a part as well. “The big organizations had big yards full of overpriced used equipment,” Hummel says. “They sold these items for what they were worth and took their hits.
“But if you remember, they had some of the highest turns in all their categories. And of course, turns improve when selling off aging inventory.”
Declining Wholegoods Gross Margins
Wholegoods gross margins dropped among both new and used equipment in the 2020 study. Total wholegoods margins averaged at 5.3% and $588,000, vs. 6% and $673,442 in the 2019 study.
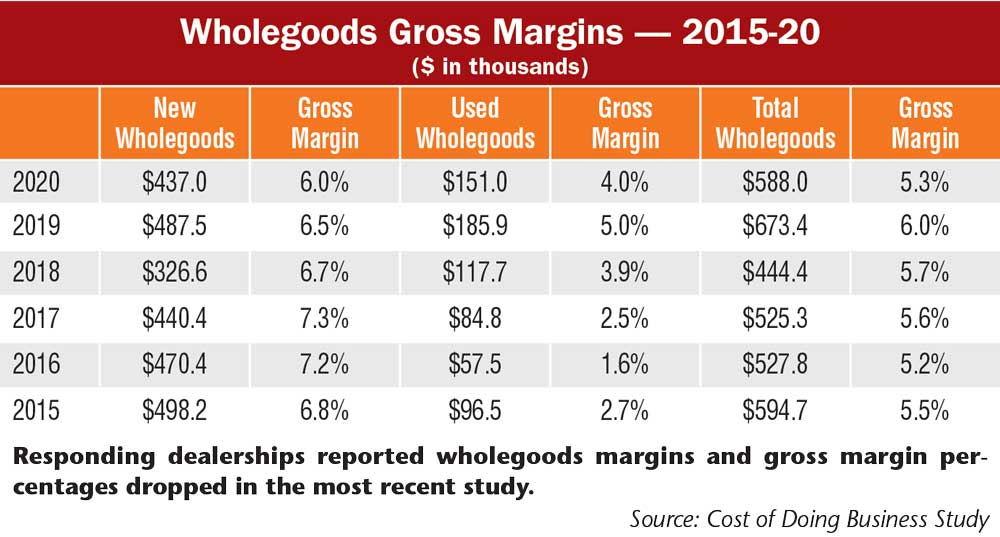
New wholegoods margins came in at 6% vs. 6.5% in the previous study, with the average margin coming in at $437,000, down from $487,519. Used wholegoods margins averaged 4% vs. 5% last year, with an average margin of $151,000, down from $185,923 in the 2019 study.
Hummel considers this an illustration of the inverse relationship between new and used margins: when one increases, the other decreases.
“We’ve always said: you should post lower gross margin on new units and higher on used,” says Hummel. “If we increase new unit margin, we automatically drive down our used gross margin. And if we reduce new gross margin, our used margin improves. Either way, we’re only going to end up with a total margin between 5-6%. As much as you want to believe we’re getting 7-10 points on new, by the time we factor the cost of sale and so forth, it’s just not there.”
He adds, though, that these numbers don’t account for equipment that isn’t selling. “We have a number of dealerships reporting yards full of 3-5-year-old equipment,” he says. “If dealerships sold their aged equipment for fair market value, their used equipment margin will sink further.”
The State of Used Equipment in Canada
In a recent Farm Equipment webinar, Trent Hummel and Curt Kleoppel, CPA, CVA, discussed the current differences between the U.S. and Canadian used equipment markets. Hummel explained how Western Canadian dealerships had managed to clear out their used equipment despite COVID-19 and what benefits came with that.
“In the 2019 calendar year, Canadian dealers were in a real pickle holding too much used,” he says. “They shorted their 2020 new stocking orders. Most of Western Canada has had a fairly good run at cleaning up their used equipment levels. The market was very active during COVID-19 and many dealerships retailed their aging items.”
Hummel continues to forecast good business for Canadian dealers over the winter. “Their pre-sales will be high this fall,” Hummel says. “Their yards are empty, there’s going to be a lot of business being done. It’ll be hot right through until springtime, there’s just too much activity in the world, with countries shoring up their food reserves because they’re scared COVID-19 might shut down a shipping post. So this is going to be one great winter.”
Parts Sales Need Work
Looking at parts sales, the 2020 study shows the average store had 16.7% of its sales in parts, above the 16.3% reported in the 2019 study but below the 18% reported in the 2018 study. Average total parts sales in the 2020 report were $2,548,000, the highest average recorded in the last 6 years.
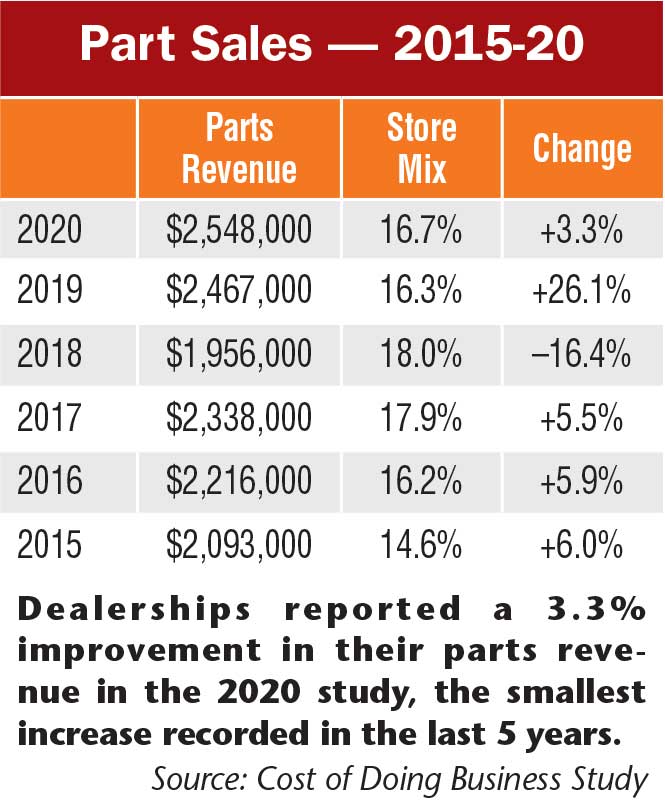
Hummel says dealers need to push for a 20% parts mix. “In total store revenue, we target 20% or more to be parts retail, and we haven’t hit that in the last 6 years,” he says. “The increase in parts revenue is good while maintaining a steady revenue mix, it means the other departments are growing right along with parts revenues. But this is the time to get focused on aftermarket sales. When you can get parts mix up above 20%, you might hit 80% absorption. Then you’re in the driver’s seat as a store.”
Taking aftermarket business back from co-ops is one idea Hummel offers as a way to improve aftermarket revenues. “We shouldn’t let the farm co-op stores have our parts business,” he says. “We need to become better marketers. Some of the best parts people we come across are hired from NAPA or Auto Parts Plus. They know how to market the showroom and how to service a parts customer. They know how to upsell.”
Parts Gross Margins on the Rise
The average gross margin on parts rose to 31% in the 2020 study, up from 30.9% in the 2019 study and 30% in the 2018 study. At the same time, margin dollars were up 3.5% to $790,000 from $762,957 in the 2019 study. Kleoppel remarks that the increase in margin percent and dollars is promising, but Hummel points out that while the industry is hitting its 30% goal on parts gross margins, it’s important to not forget to keep track of your margin dollars as well.
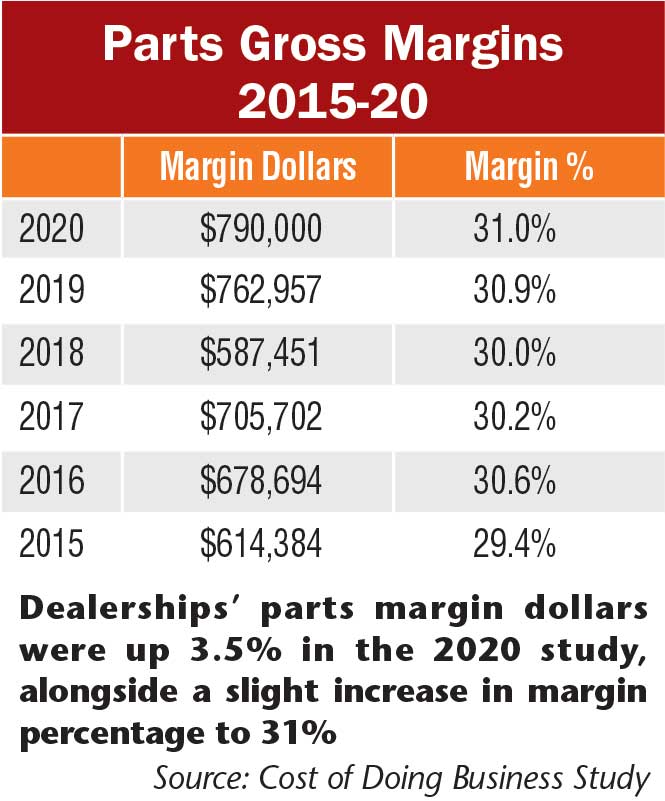
“What concerns us is, we know many dealerships achieving 32-35% parts margins, which equates to other dealerships only realizing 25%,” he says. “The difference between 2018 and 2019 gross margin is only 1%. Don’t just focus on the 30% margin target, you’ve got to always look at the margin dollars, which is how we cashflow a dealership.”
Working to Raise Service Revenue
In the 2020 study, dealerships reported their service sales revenue and store mix were mostly flat year-over-year. Average service sales revenue came in at $996,000, up 0.4% from $992,000 in the 2019 study. The average store mix of service sales remained unchanged year-over-year at 6.5%. Like with parts gross margins, Hummel pushes dealerships to increase their aftermarket mix as this allows dealerships to be more selective of wholegoods retails.
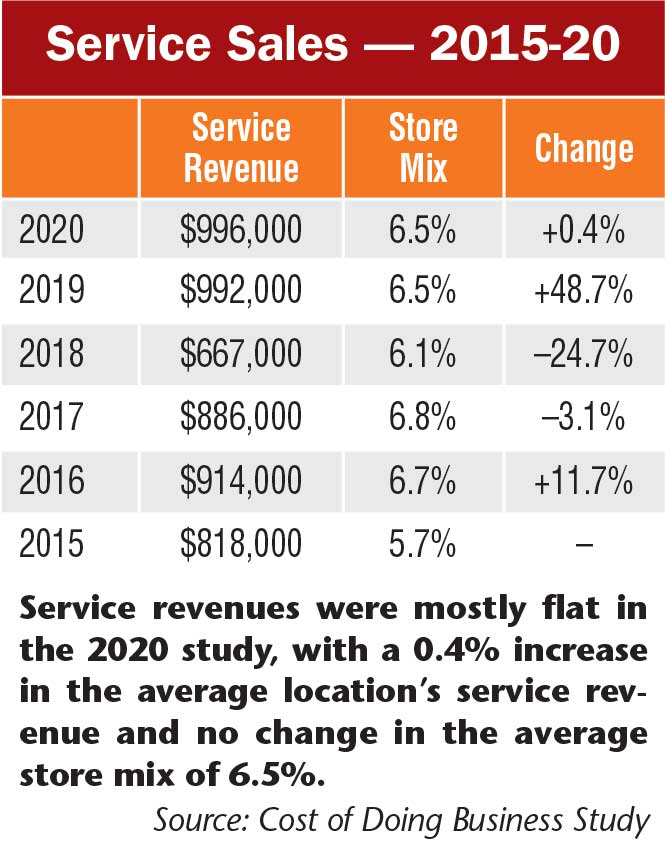
“Service sales are growing right alongside parts and wholegoods, which is great because revenues are maintaining a balance,” he says. “But because it’s so balanced, we haven’t improved much from 5.7% service mix in 2015. If we grow parts margins to 20% and your service to 10%, 30% of your revenues will be in aftermarket. Then we have a lot of cash, letting you pick and choose what kind of wholegoods deals you want to walk away from.”
Hummel also cautions dealerships against the temptation to grow their aftermarket sales internally. “We run into this quite a bit,” he says. “You don’t want to trap all your parts and service on wholegoods items that are sitting in the yard. Grow aftermarket with customer business, that’s where the cash is.”
Kleoppel adds that internal work doesn’t usually increase the bottom line, but actually hurts it as used equipment often receives the work. “If you can’t sell used equipment and make a good margin, then what have you gained?” he says.
Service Gross Margins Improve
While service sales didn’t shift much in the 2020 study, service gross margins saw its highest reported percentage in the past 6 years. Dealers reported the average margin percent at 63.1%, up from 60.1% in the 2019 study and above the 2018 percentage of 62.7%. This also marks the sixth year in which dealers’ service gross margins have surpassed the minimum industry target of 60%. Margins dollars also got a bump, coming in at $629,000, up 5.5% from $596,000 in last year’s study.
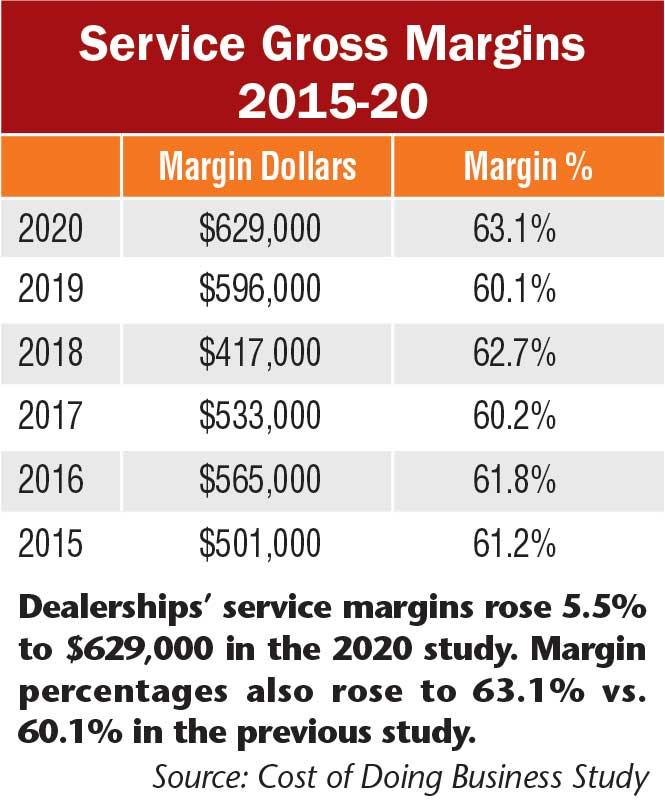
Hummel and Kleoppel agree that, like with parts gross margins, dealerships finding themselves below the 60% goal need to focus on working to increase their service margin percentage, but not at the expense of adding technicians.
“We know there’s some dealerships getting only 50% in service gross margin,” Hummel says. “We need to be getting every nickel out of service. This is where money is made.
“But don’t add service techs and believe it will grow gross margin percent. We need to improve processes in order to improve service margin with the current techs.”
Expenses on the Rise
Looking at the previous 5 Cost of Doing Business studies, dealers have struggled to keep their expenses at or below 12% of their revenue. The 2020 study was no different, with the average percentage coming in at 14.6%, above the 13.9% recorded in last year’s study. Total expenses also increased in the 2020 study, rising 5.3% to $2,221,000 from $2,109,000 in last year’s study.
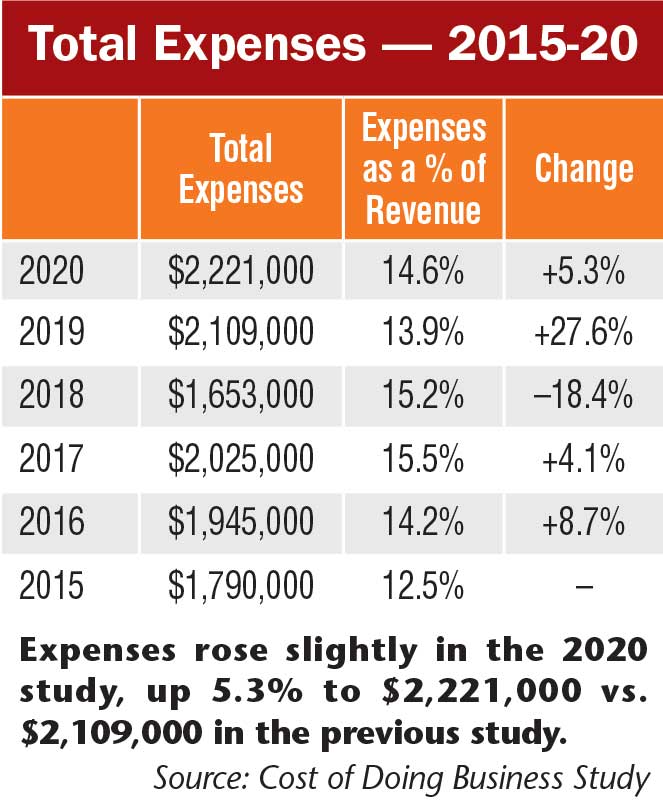
“One of the first places we go to when reviewing dealerships’ financials is their expenses as a percent of revenues,” says Hummel. “If they’re at 8-9%, they’re likely making money. But when expenses are 15-16% of total revenue, dealerships struggle to earn enough gross margin dollars to cover expenses. It’s too competitive in this industry to cover that kind of expense load.”
“You need to look at the individual dealerships too, because there’s some dealerships with a little more gross margin revenue than the larger dealerships,” says Kleoppel. “Maybe their expenses are 17-18% of their revenue, but they have a much higher gross margin than normal. Their bottom line is still very good. I think you have to look at your own unique situation.”
Gross Margin Dollars Well Spent
One metric Hummel and Kleoppel focus on is how dealers are spending their gross margin dollars, or their available income dollars. Hummel admits this isn’t a metric that many in the industry watch, but it highlights important industry goals that dealers seem to be hitting overall.
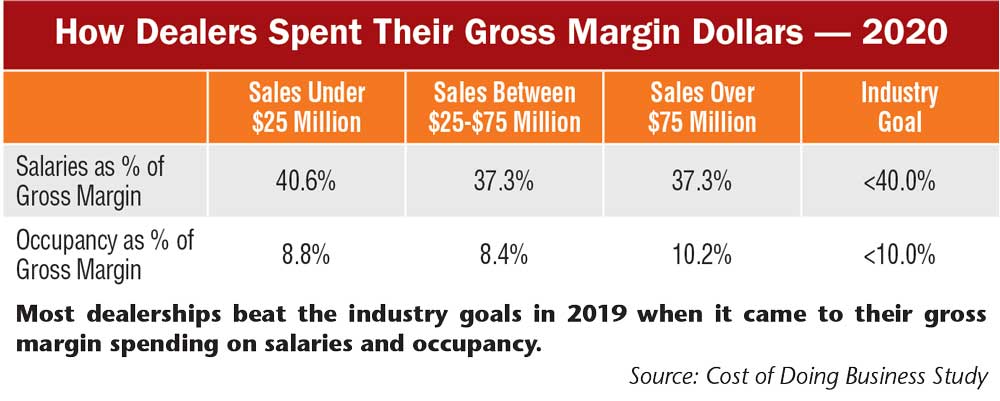
“As a percentage of gross margin, salaries should be under 40%,” he says. “You can see we’re not too far from that. The dealerships with under $25 million sales are at 40% and the other groups are at 37.3%, so we’re doing well there.”
Hummel remarks on the potential in these percentages for dealers to increase their income. “When I drafted the presentation, I thought, ‘Good, there’s room for every dealership category to make money, because salaries and occupancy are the two biggest expenses in the store,’” he says. “Combined, these categories use up 50% of your available income.”
He notes that dealers seem to also be hitting the target of their gross margin spending on occupancy (which encompasses rent, real estate taxes, repairs and maintenance and utilities). In this category, dealers with under $25 million in sales are spending 8.8% of the gross margin dollars on occupancy, dealers with $25-$75 million are spending 8.4% and dealers with over $75 million in sales are spending 10.2%, the only group to surpass the industry goal of under 10%.
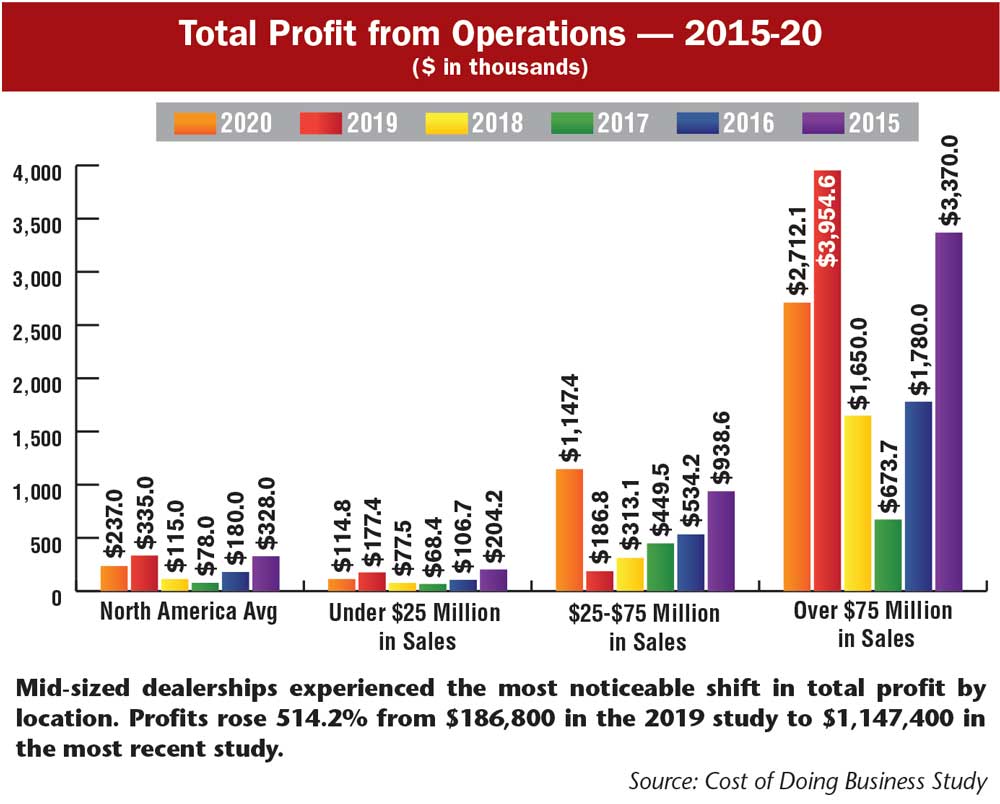
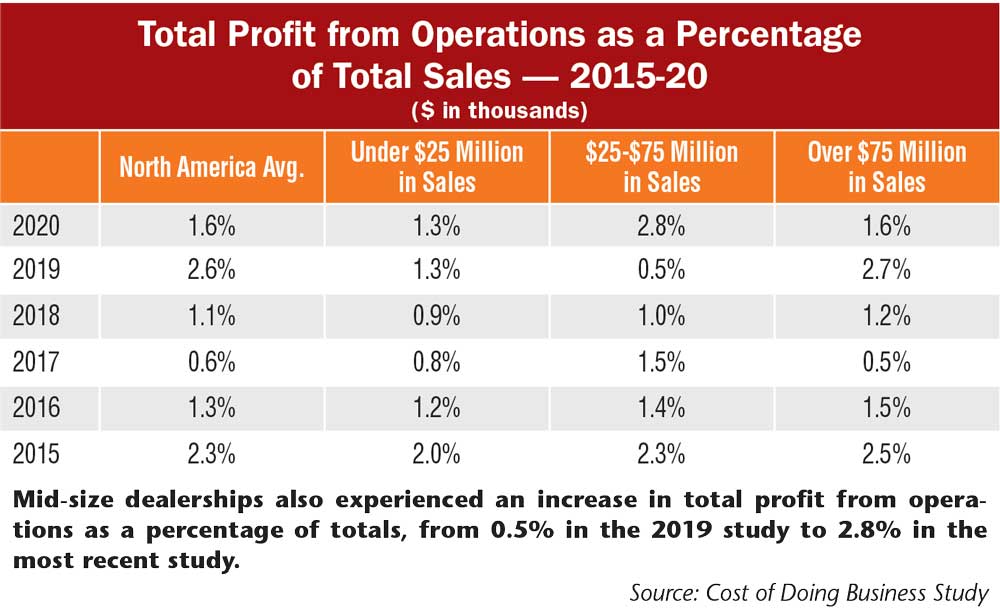
Profits Down, Interest Up
Dealer reported a drop in their profit from operations in the 2020 study, with the average location reporting $237,00 in profit, down 29.3% from $335,000 in last year’s study. Profit as a percentage of revenue also decreased, dropping to 1.6% from 2.6% in the 2019 study. This ties into dealers’ selling of used equipment, say Kleoppel. “It goes back to Trent’s comment on selling used equipment for whatever you could get. It decreased overall net income, which I think had a lot to do with the profit as a percentage of revenue.”
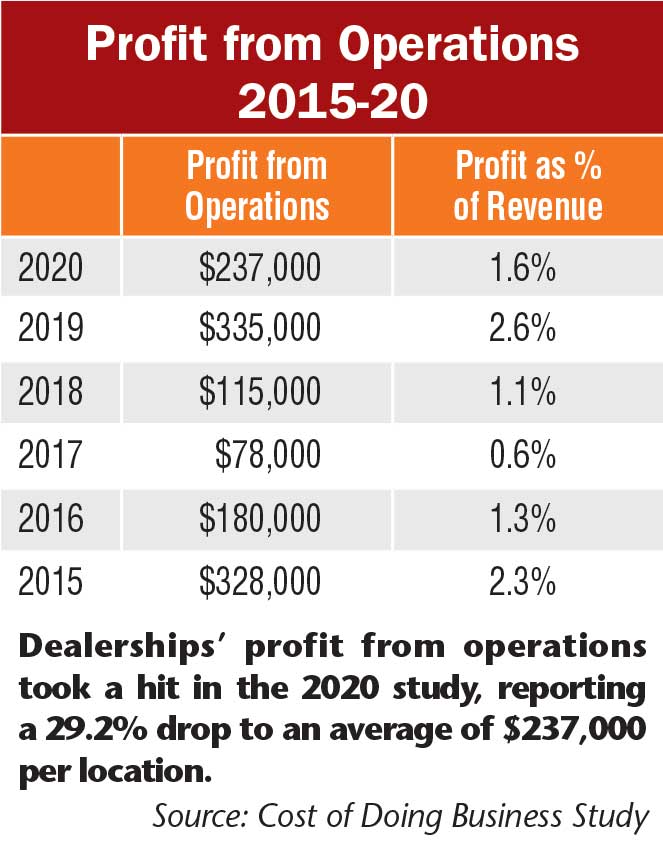
Hummel expects the industry target for profit as a percentage of revenue to rise from 3% to 5%. “I’ve had plenty of dealerships tell me they’ve thrown 3% out the window and their new target is over 5%,” he says. “They’re just not going to do this much work, risk this much money and not earn at least 5%. I don’t know if the costs of doing business will change the target or not.”
Interest dollars spent (including floorplan and loan expenses) experienced a noticeable spike in the 2020 study, up 33.7% from $95,000 in the 2019 study to $127,000 in the 2020 study. Interest as a percentage of expenses also increased, hitting 0.8% vs. 0.6% in last year’s study. Hummel emphasizes the importance of considering any reduction in interest spending a direct contribution to profit.
“We spend a lot of money in this business on interest,” he says. “If we only spent half of that amount, the half would become profitable dollars. Interest is not recoverable. We’re throwing money away as we pay interest.
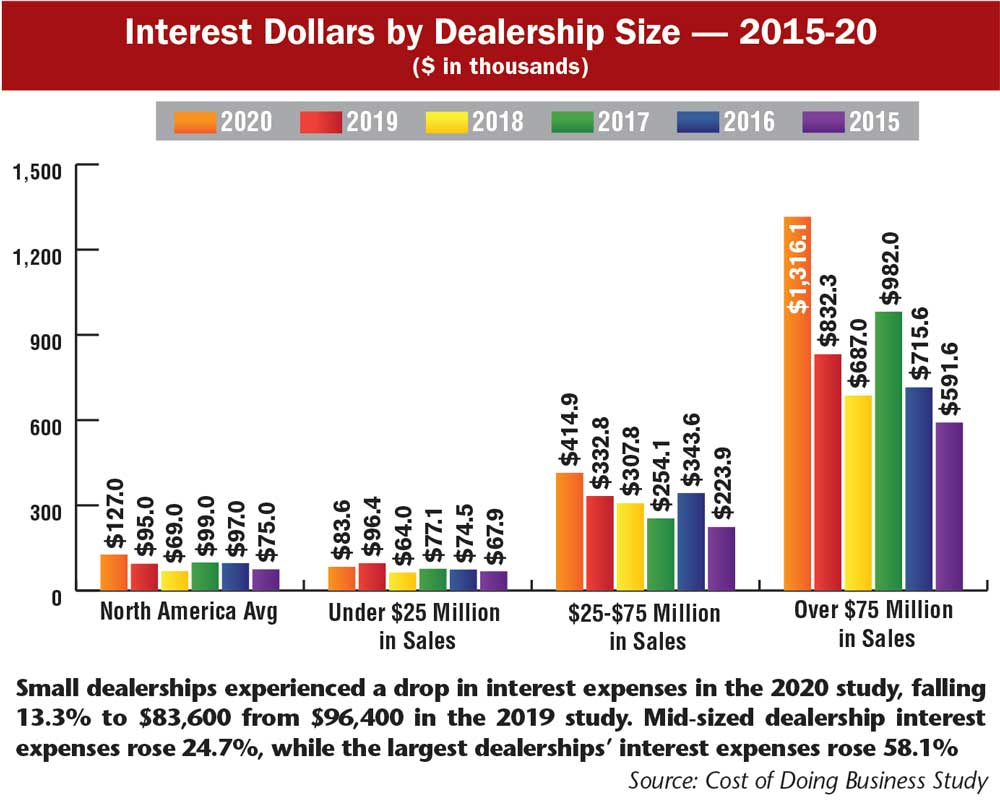
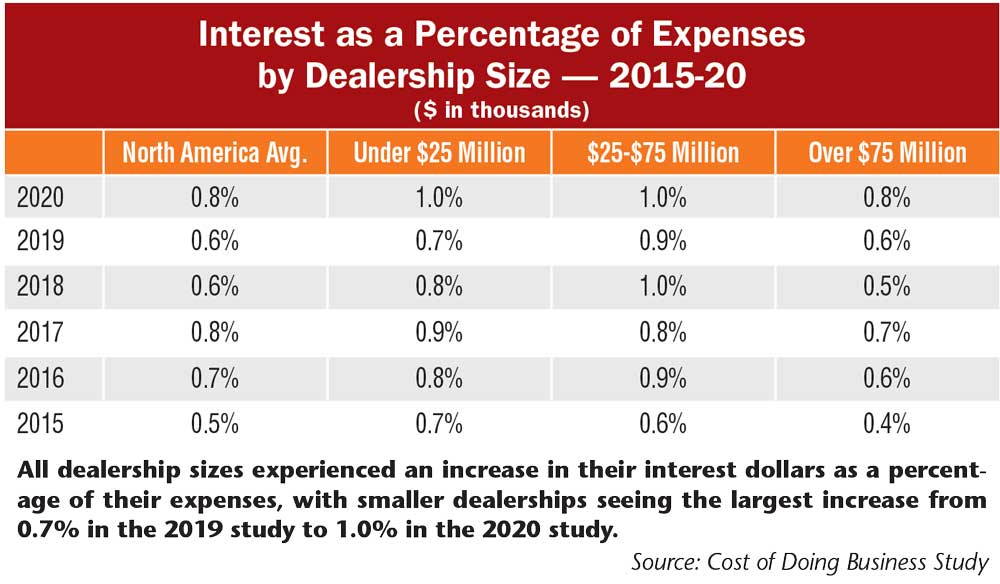
“I was impressed that each location is only spending about $100,000 in interest the last few years. With some of the horror stories that we hear from dealerships telling me how much interest they’re paying, we thought it would have been higher.”
“I think part of the higher interest dollars for 2020 equate back to the increase in total inventory dollars,” adds Kleoppel. “That would equate to more floorplan interest being paid. It’s not alarming, but if you can cut those interest dollars, it helps your bottom line overall.”
Kleoppel adds that, with interest rates dropping even more in 2020 than they did in 2019, he expects a drop in inventory levels and thinks dealers could see a drop in interest dollars spent.
Return on Assets, Equity Down
While their interest payments increased, dealers reported their return on assets and equity were both down in the 2020 study. Return on assets was nearly cut in half, falling to 3.2% from 6.1% in the previous study, well below the industry goal of over 6%. Still, return on assets increased relative to 2018, when return was 2.9%.
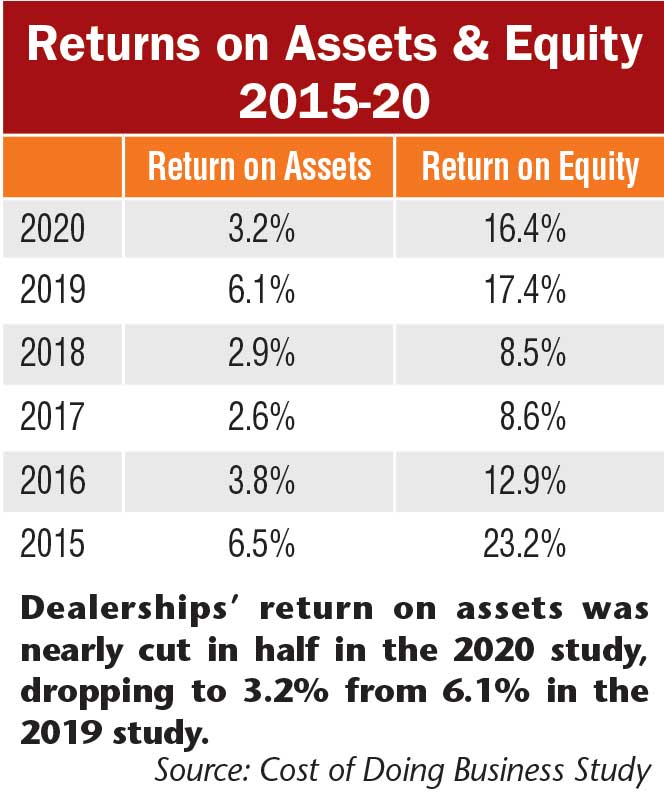
Return on equity saw a less severe decline, dropping to 16.4% from 17.4% in the previous study, also below the industry goal of over 20%. Like return on assets, return on equity still surpasses some previous years, such as 2018 when the percentage was 8.5%.
“When you see an equity drop, you’re going to have a rise in return on equity,” says Hummel. “We don’t want dealerships to focus on return on equity and say, ‘Look at how this number improved from 2018-20.’ It did improve, but only because average total equity was reduced.”
Small Dealership Absorption Needs Work
In breaking down absorption by dealer volume of sales, Hummel points out the success the larger dealers have had and attributes it to their ability to achieve around 35% gross margin on their parts. Dealers with over $75 million in sales had a total absorption rate of 66.9%, with 37.9% being in parts and 29% being in service. The general industry goal for total absorption is 100%.
He points out, however, that the smaller dealerships have room to improve, achieving 53.8% total absorption from 27.3% in parts and 26.5% in service. “I challenge every parts and service department. They’ve got to grow these percentages to meet absorption targets,” he says. “You have to get really creative, don’t think like you did yesterday. Pretend your life depends on it.”
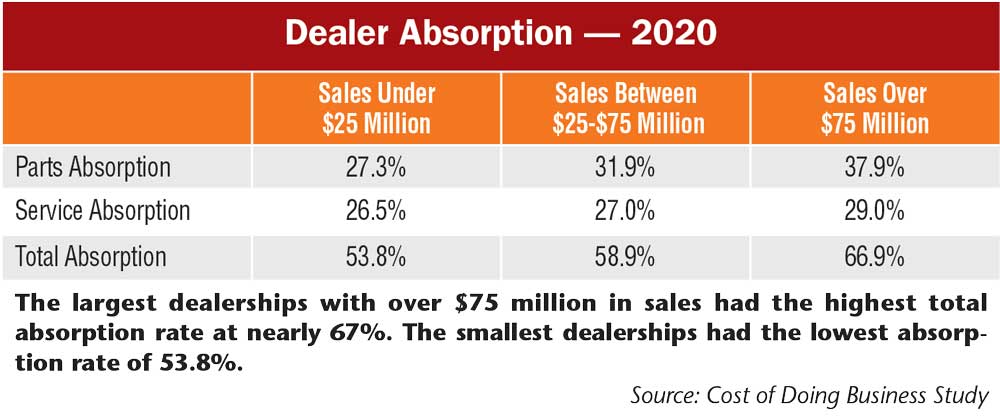
Kleoppel points out the limitations that a smaller dealership has when compared to the absorption capabilities of the largest dealerships.
“If the high-volume dealers could actually have 75% absorption, I think everybody would be tremendously happy,” he says. “And in the middle, they’d be happy to get 62-63%. But with the smaller volume dealerships, maybe they’d get closer to 58%. It might be fairly hard for a smaller dealership to get 70% or 75% total absorption, and it also depends on how many internal charges you have.”
How to Get and Use the Cost of Doing Business Study
One of the most frequently asked questions from dealers about the Cost of Doing Business Study, which is compiled by the Western Equipment Dealers Assn. annually, is “How can I use this study?”
Curt Kleoppel, WEDA’s CFO and president of Equipment Dealer Consulting, and Trent Hummel, consultant and Dealer Institute specialist, provided an analysis of the 2020 study during a Farm Equipment webinar and took time to answer the question about how dealers can make effective use of this study and relate it to their own operations.
The first thing Kleoppel makes very clear is that the information presented in the 2020 study is based on dealers’ 2019 financial data. Also, he says, the numbers are averages per dealer location. “If you operate multiple stores, you would multiply the data presented by your number of locations and go from there.”
In the general report, the numbers represent North American averages. This is what’s covered in this Farm Equipment report. To bring the information closer to home, Hummel suggests that dealers order the Cost of Doing Business report for their region. It is also available by sales volume and broken down for stores with $25 million or less, $25-$75 million and more than $75 million in annual sales.
With the region report, study the trends and compare them to your own data. “You can then see if you’re trending up or down with the various industry metrics,” Hummel explains.
He also points out that dealerships who participate in the study can get a free copy of the report from their regional association. Non-participating dealerships can purchase the results from their associations. Participating dealership associations for the 2020 edition are the Deep Southern Equipment Dealers Assn., Midwest-Southeastern Equipment Dealers Assn., Northeast Equipment Dealers Assn., United Equipment Dealers Assn. and the Western Equipment Dealers Assn.
For questions or to learn how to access the survey results, please contact Lonnie Finch, DPA, Equipment Dealer Consulting LLC at 800-762-5616 or email him at lfinch@westerneda.com.