North American dealers reported strong financial results for 2021, according to the results of the 2022 Cost of Doing Business study from the North American Equipment Dealers Assn. (NAEDA). Average dealer revenues were up year-over-year for new and used wholegoods, parts and service. Margins on both new and used wholegoods sales were up but were down for parts and service. The average dealer profit from operations was $759,000, up 54.3% from $492,000 in 2020 and made up 3.7% of revenue on average.
The 2022 study covers dealers’ metrics from 2021, and averages are reported on a location basis. Results from Canadian dealers were converted to USD when results were compiled. The results were analyzed in a recent Farm Equipment webinar by Curt Kleoppel, NAEDA’s CFO and Kelly Mathison, a former Dealer Institute trainer and dealership partner, who broke down the nuisances of the data for dealers.
Notable in this year’s study is an update to the sales volume breakdown categories for dealers into under $50 million, $50-$150 million and over $150 million. Previously, the breakdown had begun with an under $25 million category.
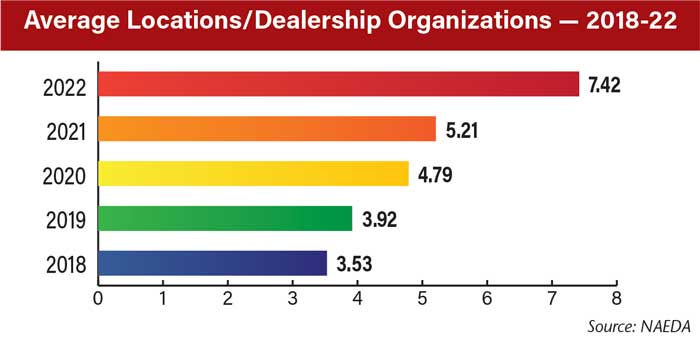
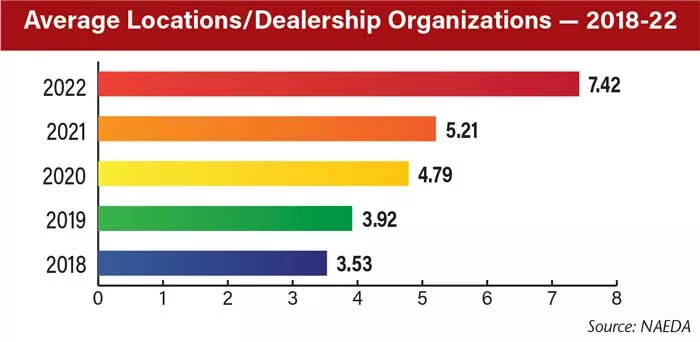
The average locations per participating dealership rose once again to 7.42, more than double the 3.53 average reported in 2018.
“A lot of dealers, a few years ago, might have picked up a smaller or neighboring dealer and added that to their group. Now we’re seeing these large groups with 10 or 15 stores taking on another group or merging with another group with 10 or 15 stores,” says Mathison. “And so we’re really going to see this explode. I know across Western Canada, we’ve certainly seen that. And it’s not a negative trend.”

Dealers reported an average of $20.6 million in revenue per location, up 21.2% from $17 million per location in the previous report. The revenue category with the most notable year-over-year increase was new wholegoods, which rose 30.4% to $10.3 million per location on average. Mathison believes the rising equipment prices and strong pre-orders helped boost dealers’ 2021 revenue.
“Dealers have worked on getting those orders in early and working with the manufacturers even though the manufacturers have struggled getting inventory,” he says. “And some of the increase might be due to price increases. We did see some pressure with price and especially some positive numbers on the used side. So some of this increase could be attributed to higher prices.
“But on the other hand dealers have been saying their preorder status has been relatively strong, and that’s driving the sales.”
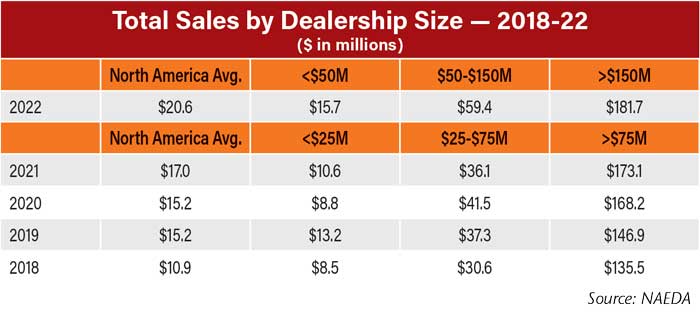
Dealers in all sales volume categories saw year-over-year increases in their sales for 2021, with dealers in the $50-$150 million category reporting the largest increase of 64.5%. Though dealers in the largest sales volume category (over $150 million) reported the smallest year-over-year increase at +5.0%, they were also the only sales volume category to see year-over-year sales increases during each of the last 5 years.
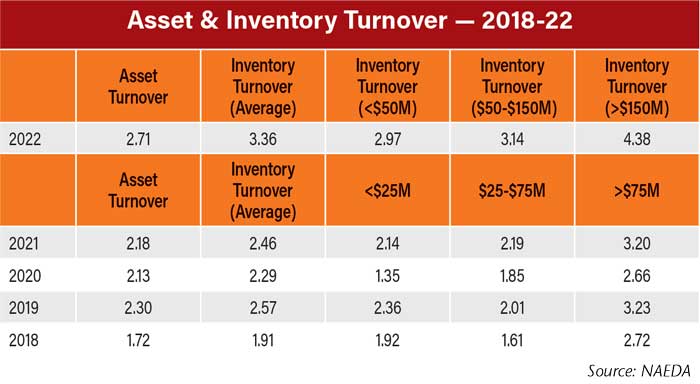
Asset turnover reached 2.71 in the latest report, up 24.3% year-over-year and up 57.6% vs. 2018. Inventory turnover also rose, up 36.6% to 3.36 and up 36.6% compared to 1.91 inventory turns reported in 2018. Dealers in the mid-range sales volume category reported the greatest year-over-year inventory turnover increase, up 43.4% to 3.14.
“Right now with interest rates going up, we want to make sure that we’re turning those dollars into revenue as quickly as possible,” says Mathison. “That middle category had struggled for a while turning that over. It’s great to see those economies of scale coming right across the board.”
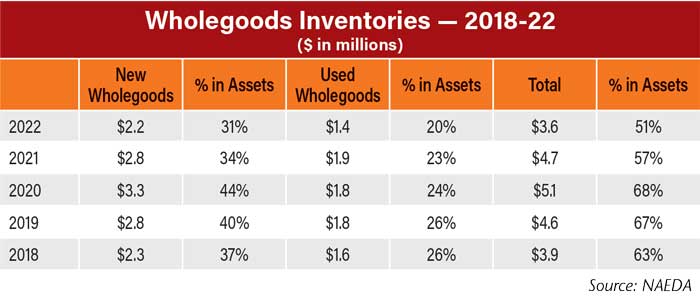
Dealers reported their inventory was down for both new and used wholegoods in 2021, with the average per location new wholegoods coming in at $2.2 million (down 21.4% year-over-year) and used wholegoods coming in at $1.4 million (down 35.7%). This put both new and used inventory levels below where they’d been in the 2018 study (reflecting 2017 data). The percentage of new and used wholegoods in dealers’ assets also reached 5-year lows.
How to Get and Use the Cost of Doing Business Study
One of the most frequently asked questions from dealers about the Cost of Doing Business Study, which is compiled by the North American Equipment Dealers Assn. annually, is “How can I use this study?”
Curt Kleoppel, NAEDA’s CFO and Kelly Mathison, a former Dealer Institute trainer and dealership partner, provided an analysis of the 2022 study during a Farm Equipment webinar and took time to answer the question about making effective use of this study and relating it to their own operations.
“The report sets benchmarks for the industry,” says Kleoppel. “It helps in mergers and acquisitions for fair valuation, as well as estate planning. It also helps Dealer Institute trainers and the dealerships involved because the dealers are benefitting from these courses and the trainers rely on these percentages.”
In the general report, the numbers represent North American averages. This is what’s covered in this Farm Equipment report.
To bring the information closer to home, it’s suggested dealers order the Cost of Doing Business report for their region. It is also available by sales volume and broken down for dealerships with $50 million or less, $50-$150 million and more than $150 million in annual sales. Dealers who participate in the study can get a free copy of the report from the regional association. Non-participating dealers can purchase the results from their regional groups.
Dealers had from May until August 2022 to submit their data. Other associations who worked with their dealer members to contribute data for the 2021 report included the Deep Southern Equipment Dealers Assn. and the Northeast Equipment Dealers Assn. Dealers who are interested in the full report and the region specific results can order them through their regional association.
For questions or to learn how to access the survey results, please contact Lonnie Finch, CPA, Equipment Dealer Consulting LLC at 800-762-5616 or email him at lfinch@naeda.com.
“A few years ago if somebody said you could get to only 51% of your assets tied up in new and used equipment, I think a lot of people would’ve said that’s not possible,” says Mathison. “And some of this inventory is expensive. The prices have gone up, and yet the dollars we have invested as our total assets have come down.
“This really sets us up well. I’ve mentioned over the years that the dealers who got into trouble back in the 80s, it usually was a buildup and having too much of their money tied up in new and used equipment or aged equipment. And now with interest rates going up, if you can’t turn that into cash, that can be a problem.”

After rising 31.4% to $2,881,000 in the previous study, dealers’ average total equity per location dipped to $2,721,000 in the latest study. At the same time, the average percentage of dealers’ equity as their total assets rose to a 5-year high of 39%, a 4 percentage point jump from the previous report. Dealers with under $50 million in sales volume reported the highest percentage of their total equity in assets at 45.6%. Mathison points out that having a higher percentage of their total assets in equity helps dealers both withstand higher interest rates and puts them in a better position if given the opportunity to merge with or acquire another dealership.
“Inventory might be down, which could affect cashflow at some point in time, but right now, there’s a lot of cash sitting in these dealerships driving up equity, which is good,” says Kleoppel.

The average debt to equity ratio per dealership location dropped to 1.56 from 1.85 in the previous study, with dealers in the mid-range showing a sizable drop from 5.12 to 2.30. Considering the target for dealers is a ratio of 3.3 or less, Kleoppel says the data is impressive.
“You don’t want to be in a heavy debt situation when those interest rates come,” says Mathison. “It’s setting us up to be in a pretty good position as long as we don’t get in the habit of overloading ourselves with inventory. But this is great to see.
“And those large dealers, even though there’s an awful lot of brand new buildings and things that have gone up across the country, like investments in service trucks and tools, it’s really great to see that the deposition is pretty good.”
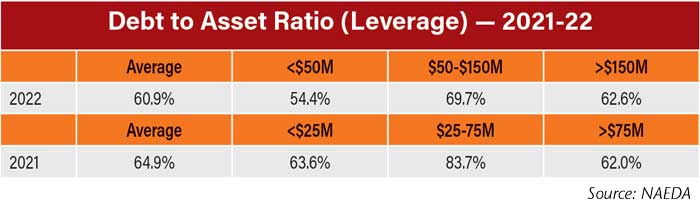
The average dealer location debt to asset ratio fell from 64.9% to 60.9% in the latest study, well below the industry target of 80% or less. Dealers in the lowest sales volume range show the smallest average ratio of 54.4%. Mathison points out that strong debt to asset ratios can make it easier for dealers’ to get good credit with banks. “They’re a lot more comfortable when you’re begging for more,” he says.
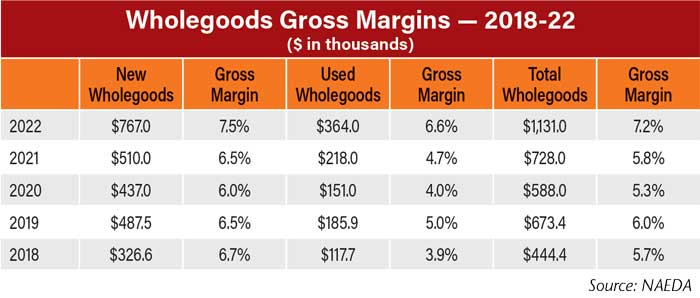
Both new and used wholegoods gross margins reached 5-year highs in the most recent report, with the new wholegoods average coming in at $767,000. That represented a 50.4% year-over-year increase, which was still less than the 67% increase that put average used wholegoods gross margins at $364,000. Gross margin on total wholegoods came in at 7.2%.
“If you have a look at say, 2018, when it looks like the new margins were strong and the used were low, to me that’s usually an indication of, ‘you thought you made a good deal on the front end, and then you had to dump the used to generate cash,’” says Mathison.
“If there’s a big spread in that number, it’s usually because you made a mistake or the market changed, and you were sitting in a poor used position. But when you look at these numbers and we’re able to hold the margins on the new as well as the used, that’s telling us we’re able to move our used equipment at a decent margin, and that isn’t a luxury we always have in this business.”
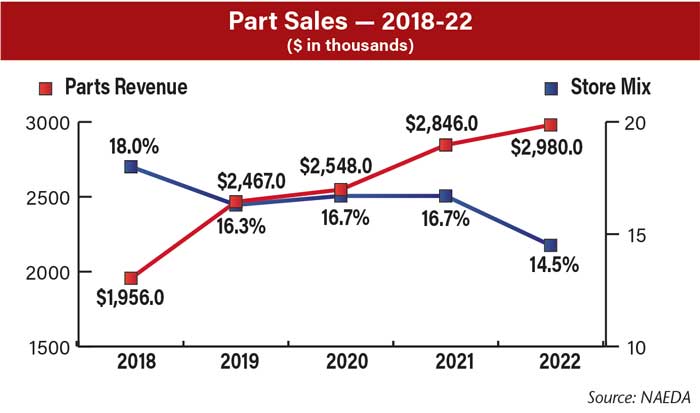
Dealers’ per location parts sales averaged almost $3 million in 2021, up 4.7% year-over-year. At the same time, however, the percentage of dealer location sales generated by parts revenue fell to 14.5%, the lowest percentage in the last 5 years. Although the target is for parts to be over 20% of the store mix, Mathison believes the stronger wholegoods sales brought down this percentage and says he’s not alarmed by it. He adds that it’s a trend to watch.
“One thing we don’t want to get into the habit of is just increasing our sales by the amount the parts prices go up. We always want to be looking for more parts sales,” he says.
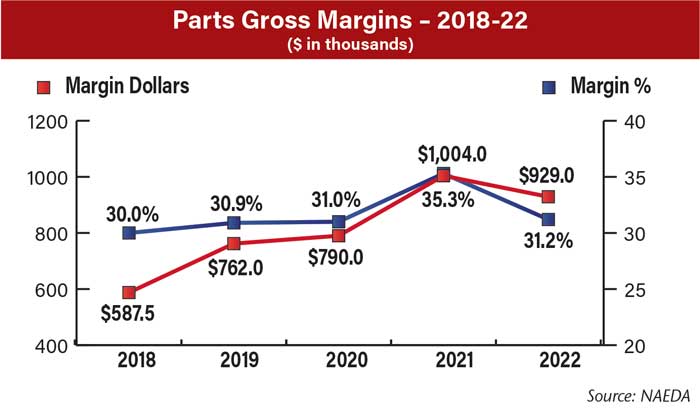
Average parts gross margins were down 7.5% year-over-year in the latest report to $929,000, while average margins fell back to 31.2% after rising to 35.3% in the previous report. This put the average percentage below the target of over 32% for the 4th time in the last 5 years.

Service revenue, on the other hand, was up year-over-year for the 4th year in a row, up 3.7% to $1,209,000 per location. Store mix, however, was down to 5.9%, once again below the industry target of over 10%.
“The wholegoods sales went up, so it makes it tough to keep that mix. But this service revenue is good to see and we might see this go up,” says Mathison. “I know there’s going to be pressure on wages, to increase shop rates across the country. I know a lot of dealers hate to do that, but there’s going to be pressure, so that’s going to increase some of the service revenue dollars just because your cost is going up.”
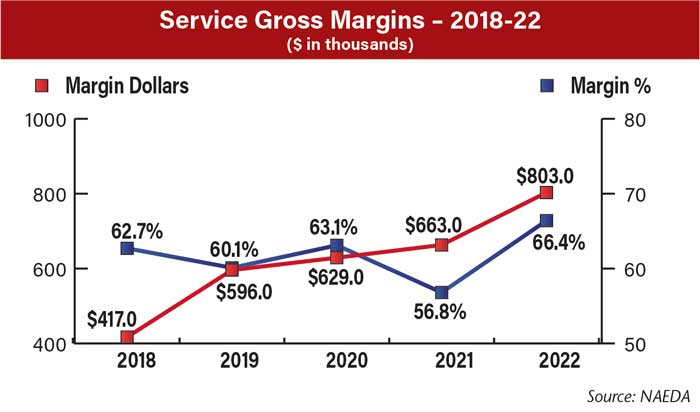
Average dealer location service margin dollars hit a 5-year high at $803,000 in this year’s report, as did the average margin at 66.4%. Mathison says he likes to see dealers with over 60% margin since he sees many dealers with service department expenses over 50%.
“A lot of dealerships, especially with the costs we have involved in buildings, special tools, service trucks, their expenses in the service department are quite often well over north of 50%,” he explains. “So when you’re thinking, ‘well, gee, that seems like a high margin percentage,’ look at your cost of sales and your expenses on the service side, they’re high. I wouldn't be embarrassed about that, a lot of dealers will tell me their expenses are well over 50%.”
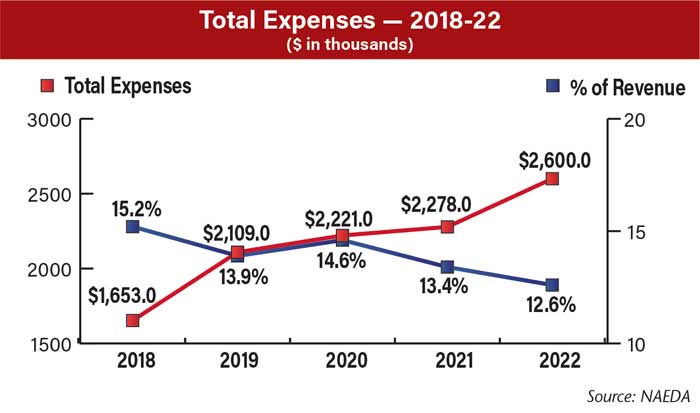
Dealers’ average per location total expenses was another metric to hit a 5-year high, coming in at $2.6 million per location. Dealers’ expenses as a percentage of their revenue, however, dropped to a 5-year low of 12.6%, the 2nd year in a row of decrease and just above the goal of under 12.5%. “This is a good sign, because sometimes when you see gross margins go up, you might see neglect in looking at fixed expenses and keeping those in checks,” says Kleoppel. “One would be health insurance, that keeps increasing year after year. You can only do so much in controlling that cost. Then I think also the other big increase is sales commissions. You saw that big increase in new and used wholegoods, so that’s going to drive a sales commission increase.”
Mathison adds that the data could be accounting for various expenses related to the COVID-19 pandemic, such as accommodating for employees working from home and implementing safety procedures in the dealership.
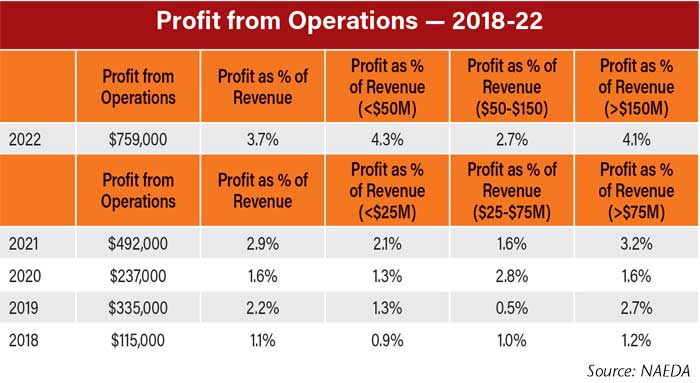
Average per location profit from operations rose for the second year in a row, up 54.3% to $759,000 and a 560% increase from the $115,000 recorded in the 2018 survey. Dealers with under $50 million in sales volume reported profit as 4.3% of their revenue per location, more than double the 2.1% they saw in the previous report and the highest percentage among all 3 sales volume categories.
“With the larger dealers, perhaps the trend is they’re taking advantage now of the economies of scale and, the profits coming in are getting right to the bottom line,” says Mathison. “And that’s great. We’re trying to always attract new investment, a new crop of people interested in this business. And if they can see that there’s a good bottom line, then you’ll get people saying they’d like to invest.
“This is a great metric to show to people in your dealership. When we would do our training programs, we would ask people, ‘How much does your dealership make on every dollar you sell?’ A lot of them will say 20 or 30 cents, and their jaw usually hits the ground when you say, on average, it’s only 2 cents.”
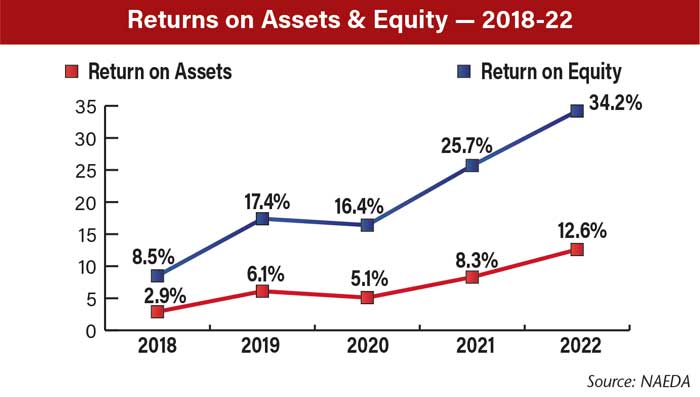
Return on assets and return on equity both hit new highs for dealers in this year’s report, with return on equity in particular jumping 8.5 percentage points to a 34.2% return. “Historically, this has been a problem in our industry,” Mathison says. “These numbers have been too low, and that’s why it’s been tough to get people to invest because we’re asset heavy, we’ve got lots of money tied up. This is really nice to see because that will bring new investment dollars into the business because they can see we’ve got a good business plan.”
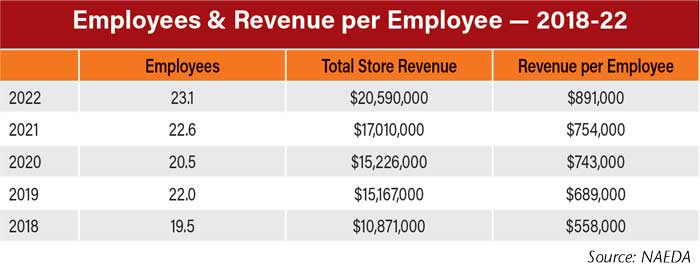
The average number of employees per dealer location rose for the 2nd year in a row to 23.1, bringing the average revenue per employee to $891,000. This represents an 18.2% year-over-year increase and a 59.7% increase from the 2018 report. Mathison and Kleoppel want dealers to aim for $750,000-$1,000,000 per employee.
“This tells you, if you’re a dealership sitting maybe at that $500,000 per employee level, you’ve got horsepower there that isn’t getting utilized,” says Mathison. “You’ve got people there who can be selling more. I’ve seen instances where a dealer might have a back parts counter person who’s pumping $2 million worth of parts sales through the shop to all the technicians. And I would say in that case, that’s expecting a lot of that person, maybe you need one and a half people looking after those technicians. That may be a bit of a log jam, if you’re too high on that revenue per employee metric.”
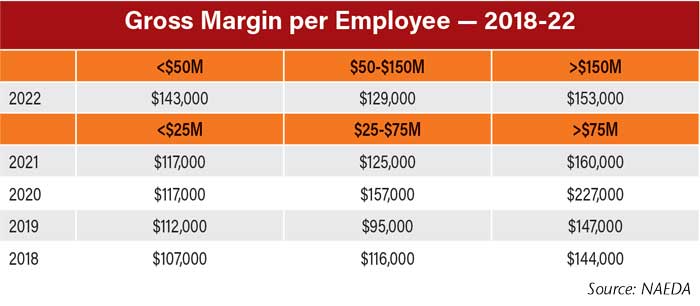
Gross margin dollars per employee was up for the smaller and medium-sized dealerships, but down slightly for the larger ones. And for just the 2nd time in the last 5 years, dealers in the smallest sales volume category (under $50 million in sales) had a higher gross margin per employee than dealers in the mid-range category ($50-$150 million). “The large dealers have, it looks like, done a pretty good job of making sure they’ve got the right people in the right places. And this can be a challenge too, if you’ve got maybe a smaller location, and you just need a minimum number of staff just to keep it rolling,” Mathison explains.
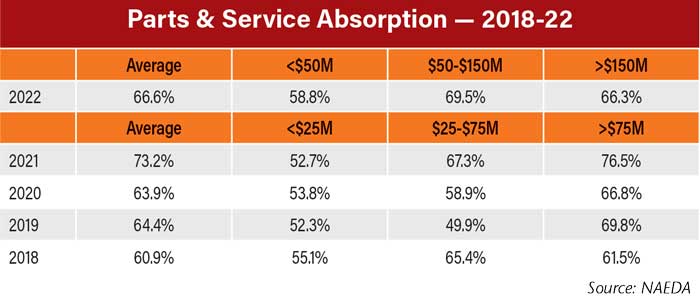
Overall parts and service absorption fell in the most recent study from 73.2% to 66.6%, though, by category, only the largest dealers (over $150 million in sales volume) showed a decline in their parts and service absorption. For the first time in 4 years, dealers in the mid-range sales volume category surpassed the largest dealers on their parts and service absorption (69.5% vs. 66.3%).


