
North American dealers reported strong financial results for 2020, according to the results of the latest Cost of Doing Business study from the Western Equipment Dealers Assn. On average per location, revenue, profit and gross margin dollars were all up. Absorption rates were up for parts and service and return on both assets and equity reached 5-year highs. However, when broken down by dealership size, those dealers with sales between $25-$75 million fared slightly worse than other dealers in some areas, including declines in revenue, gross margin per employee and equity as a percentage of total assets.
The 2021 study covers responding dealers’ metrics from 2020, and averages are reported on a location basis. Results from Canadian dealers were converted to USD when results were compiled. The results were analyzed in a recent Farm Equipment webinar by Curt Kleoppel, WEDA’s CFO and president of Equipment Dealer Consulting and Gord Thompson, WEDA subject matter specialist, Dealer Institute Management consultant and former dealer principal, who broke down the nuisances of the data for dealers.
Participating dealers had from May until August 2021 to submit their data. Results were then compiled, analyzed and presented in October 2021. Other associations who worked with their dealer members to contribute data for the 2021 report are the Deep Southern Equipment Dealers Assn., Midwest-SouthEastern Equipment Dealers Assn., Northeast Equipment Dealers Assn. and United Equipment Dealers Assn. Dealers who are interested in the full report and the region specific results can order them through their regional association.
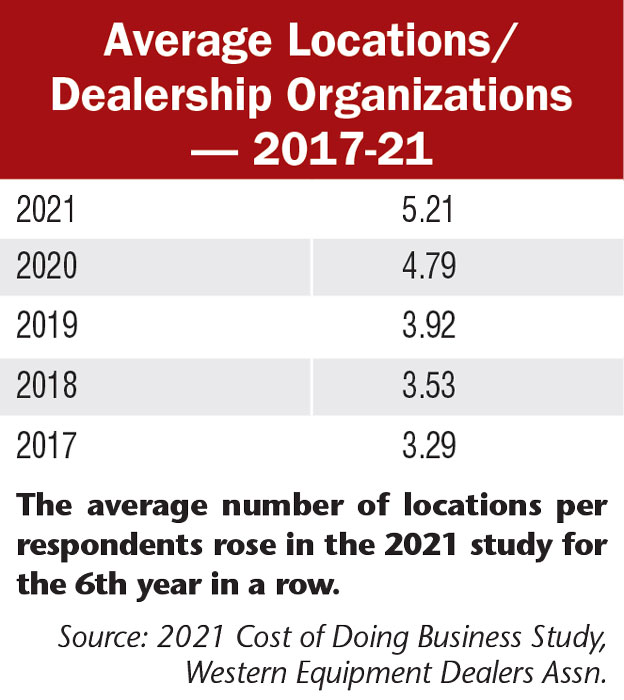
Dealership consolidation continued through 2020, with the average responding dealership reporting 5.21 locations, a 5-year high. “I can’t see this trend changing, and I think it will continue on into 2022,” says Kleoppel. “We’re starting to see other manufacturers push their dealerships to look at consolidation, so I think this number will probably grow.”
Total Revenue Up 12%
Total average revenue by location in 2020 was $17 million, up 11.8% from $15.2 million reported in last year’s study. This follows revenue being mostly unchanged in 2019 and a 39.5% jump to $15,167,000 seen in 2018.
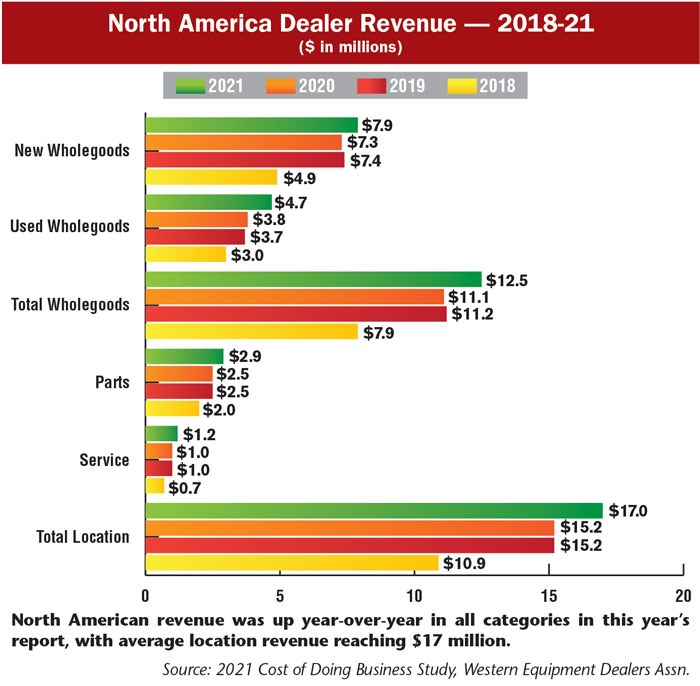
Revenue improved in all categories, with notable increases reported among used wholegoods sales, which rose 23% to $4.7 million in 2020 vs. $3.8 million in 2019. Parts revenue was also up 11.5% to $2.9 million, and service revenue was up around 17% to $1.2 million.
“Used equipment was our driver for wholegoods sales increases this year,” says Thompson. “We probably could have sold more new equipment if we could get it, but we essentially sold what was available.
“I’m particularly excited to see parts and service revenue keeping up with the total sales increase. You don’t usually see aftermarket keep up with significant jumps, so that’s a big tip of the hat for that performance.”
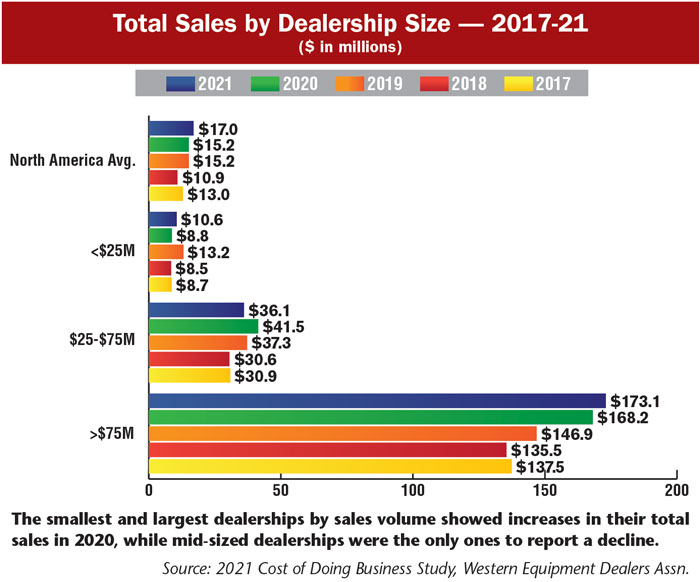
By volume of sales, the smallest dealerships (with under $25 million in sales) showed the highest year-over-year percentage increase in revenue, up 20.5% to $10.6 million. The largest dealerships (with over $75 million in sales), also reported increased revenue at $173.1 million, up 2.9% year-over-year.
Mid-sized dealerships ($25-$75 million in sales), however, reported an average revenue per location of $36.1 million, down 13% from $41.5 million in 2019.
Inventory, Asset Turnover Increases
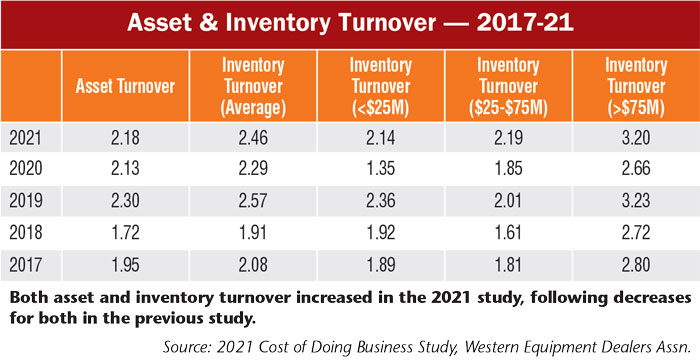
Average turnover rates were up in the most recent study, reversing the declines seen in 2019. Average asset turnover rose to 2.18, the second-highest turnover rate recorded in the last 5 years. Inventory turns (including parts and wholegoods) rose to 2.46, also the second-highest rate recorded in the last 5 years. Inventory turns were also up in every dealership size category, with the largest dealerships reporting average turnover of 3.2.
Kleoppel says two things affected the slight increase in asset turnover: dealers had more fixed assets and more cash.
“There’s an increase in assets. Dealers are buying more service trucks, service equipment and maybe doing some lease hold improvements,” says Kleoppel. “And then we also saw an increase in cash, and that’s always good. When you move your inventory and turn it into cash, there’s nothing wrong with that.”
Thompson says that while this year’s report puts dealers’ targets on asset turnover at 2.5 and inventory turnover at 3, it could be even higher for certain dealers.
How to Get and Use the Cost of Doing Business Study
To bring the information closer to home, dealers can order the Cost of Doing Business report for their region. It is also available by sales volume and broken down for stores with $25 million or less, $25-$75 million and more than $75 million in annual sales. Dealers who participate in the study can get a free copy of the report from the regional association.
Non-participating dealers can purchase the results from their regional groups. Participating dealer associations for the 2021 edition are the Deep Southern Equipment Dealers Assn., Midwest-Southeastern Equipment Dealers Assn., Northeast Equipment Dealers Assn., United Equipment Dealers Assn. and the Western Equipment Dealers Assn.
For questions or to learn how to access the survey results, please contact Lonnie Finch, DPA, Equipment Dealer Consulting LLC at 800-762-5616 or lfinch@westerneda.com.
“We could argue that inventory targets could be 3.5 for the largest dealers,” he says. “Maybe it could be 3 for new wholegoods and 3.5 or 4 for used. Going forward, the availability of new equipment is probably going to really drive what our new turns are, and that number could get really low.”
He adds that the uncertainty around equipment delivery dates could make it more difficult to pre-sell trades.
“It could be complicated if you’re trying to figure out whether or not the new unit you sold to a customer is going to arrive on time for you to sell their trade. If it’s not arriving in time, you have to wait on selling the used. I think there will be some stress on used turns.”
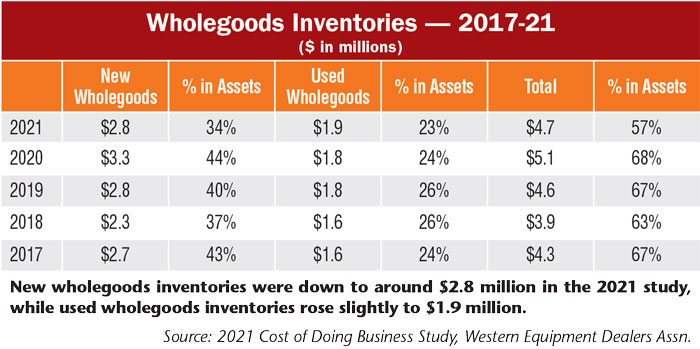
New Inventories Down, Used Up
Total wholegoods inventories dropped almost back to 2018 levels in the most recent study, with the average location reporting $4.7 million in total. Of that, $2.8 million was in new wholegoods (down 15.2% year-over-year) and $1.9 million was in used (up 6% year-over-year). Notably, the percentage of both new and used wholegoods inventories in assets fell in the 2021 report, with just 57% of all wholegoods in assets vs. 68% in last year’s study.
“The percentage of total assets in new equipment is down from last year, which is an historically low number,” says Thompson. “We’re expecting the percentage of wholegoods inventories in assets to go down, just due to demand and availability.”
Kleoppel says 57% of wholegoods inventory in assets is the lowest he’d want to see and hopes to see some increases in next year’s report.
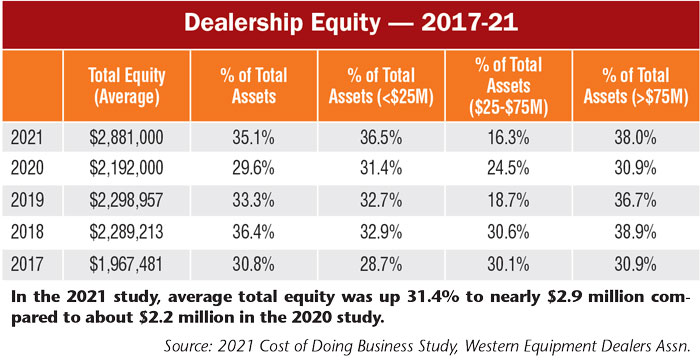
Dealers Report Higher Equity
Average dealership equity per location was up 31.4% in 2020 to $2,881,000, a record high for the last 5 years. The percentage in total assets came in at 35.1%, reversing the drop seen in last year’s study but not surpassing the 36.4% recorded in the 2018 study.
By dealership size, the largest dealerships reported the highest percentage of their equity in assets at 38%, followed by the smallest dealerships at 36.5% and mid-sized dealers at 16.3%. Both the largest and smallest dealers reported increases in the percentage of their equity in assets year-over-year, while mid-sized dealers reported a drop to 16.3%, a 5-year low. Thompson says dealers should target having 30-40% of their equity in total assets, though that number can vary notably in different situations.
“Some consolidations that were planned maybe didn’t happen, so some money probably didn’t get spent,” he says. “Even when you wanted to do your fixed asset additions, sometimes there’s limitations on availability of what you could do. When things are a little uncertain, and COVID-19 caused a lot of uncertainty, people tend to avoid making big decisions, which I think is reflected here.”
Thompson points out his confusion over why mid-sized dealers reported such low equity in this year’s report, which Kleoppel theorizes could be due to an increase in treasury stocks.
“The increase in treasury stocks tell me there’s quite a few shareholders that were being bought out in this category of dealerships, which decreases equity and increases notes payable to the bank, in order to finance the buyout,” says Kleoppel. “With the pandemic and the age of some of our dealership owners, they probably thought now was the time to get bought out. But these dealerships are still making money, and I wouldn’t be surprised if this percentage goes back up to 25-26% next year.”
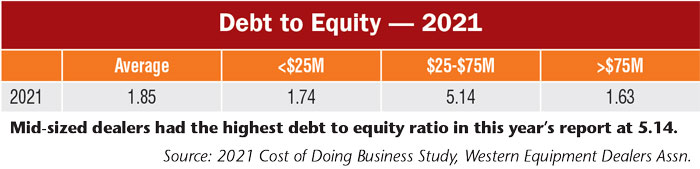
Comparing Debt to Equity, Assets
The average debt to equity ratio came out to 1.85 in this year’s report, with the largest dealers reporting the lowest ratio (1.63) and the mid-sized dealers reporting the highest ratio (5.14). The target for dealers is a debt to equity ratio of 3.3 or less.
“It does 2 things when you have low equity,” Thompson says. “It leads to a higher return on equity with a relatively low income level, but it can also mean that cash can be tight in the cycle if there’s a wobble, so you have to be careful if you’re in that situation.”
Dealers’ debt to asset ratio, which Thompson says should be less than 80%, came in at 64.9% on average per location. Broken down by dealerships size, the percentages followed a similar pattern as the debt to equity ratios, with the largest dealers reporting the smallest ratio and the mid-sized dealers reporting the highest.
-%E2%80%94-2021_700.jpg)
“Once you get over 80%, accessing funds can get a little tougher,” says Thompson. “We’re in a short-term situation with those mid-sized dealers, who need to generate a bit of cash for a period of time to pay off this debt.”
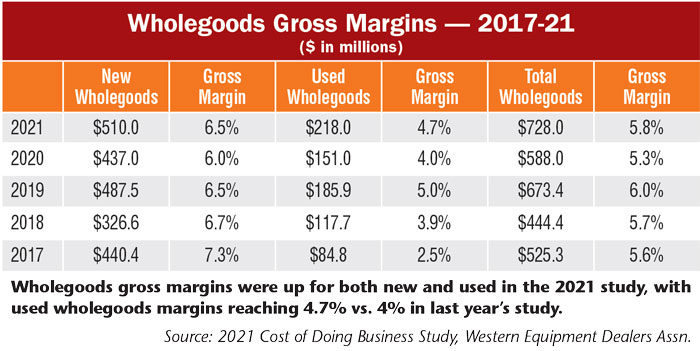
Wholegoods Margins Dollars Reach New Highs
Wholegoods gross margins rose for both new and used categories in this year’s report and values for both reached 5-year highs. New gross margin dollars were up 16.7% to $510,000, while used gross margin dollars were up 44.4% to $218,000. Total wholegoods margin dollars came in at $728,000 vs. $588,000 in last year’s report, an increase of 23.8%.
“Margins are back to the range they’ve been in for the past few years,” says Thompson. “So this tells us we’ve sold more, not so much that we made more money on individual deals. The results are good, but we didn’t do anything radical.
“I’m happy to see the spread between the new margin and the used margin has narrowed. It’s gone from 2 to 1.8. When you see a big spread, it usually indicates you had to dump some used equipment, and you took a hit on it. The other factor that we think was at play here is that equipment has gotten pretty expensive based on what dealers have to pay for it, and the more expensive the unit you sell, the harder it is to get more margin.”
“I think it’s a good comeback, especially from last year,” adds Kleoppel. “From what I’ve heard, the sales volume is there, so hopefully the market is there too. Maybe next year we might see these percentages increase.”
Part Sales Continue to Rise
Looking at part sales, the 2021 study shows the average store had 16.7% of its sales in parts, unchanged from the 2020 study. Average total parts sales were $2,846,000, the highest average recorded in the last 5 years and a 12% year-over-year increase.
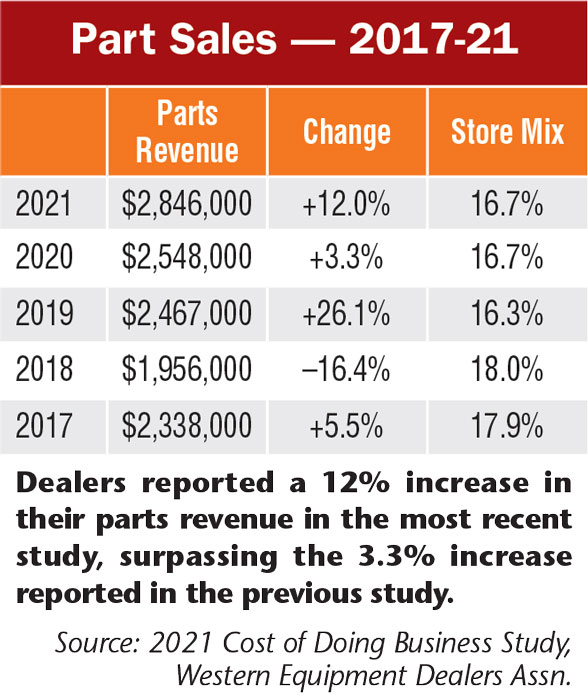
Thompson notes heightened interest in the last 3-4 years on the aftermarket side of the business, as dealers look more to that arena for generating revenue.
“Dealers have realized they’ve just got to generate more dollars out of the aftermarket to make their businesses a little more bulletproof,” he says. “We’re seeing it this year, they didn’t just run with new and used sales, aftermarket kept up.”
He says that while the goal for store mix is 20%, it’s been a long-term project they plan to continue with.
To Kleoppel, the increase in parts sales mean more dealerships are investing in training their parts people, which has increased margins and sales.
Parts Gross Margin Dollars Reach $1 Million
The average gross margin on parts rose to 35.3% in the 2021 study, up from 31% in the 2020 study. Margin dollars were up 27.1% to $1,004,000 from $790,000 in the previous study.
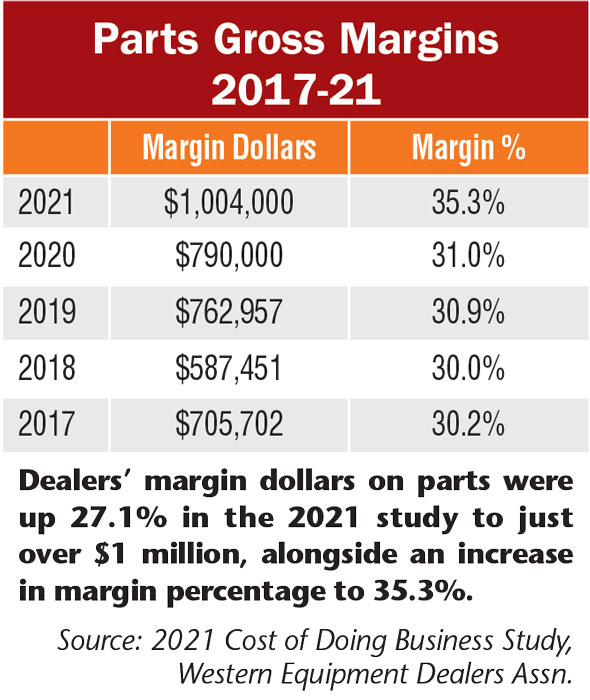
“I would say the parts margins knocked it out of the park, I did not expect to see that level of increase,” says Thompson. “This is well above our industry target of over 32%.
“Looking at total margins dollars going to just over $1 million, what we see is probably two-thirds of the increase due to margin percentage increase and a third of it due to sales.”
Service Sales Up 17%
In 2020, the average dealership location reported $1,166,000 in service revenue, a 17.1% increase over $996,000 in 2019 and the third year of increase. This represents a 74.8% increase from the $667,000 average location service revenue reported in the 2018 study. Store mix on service sales also rose to 6.9% vs. 6.5% in the two previous reports.
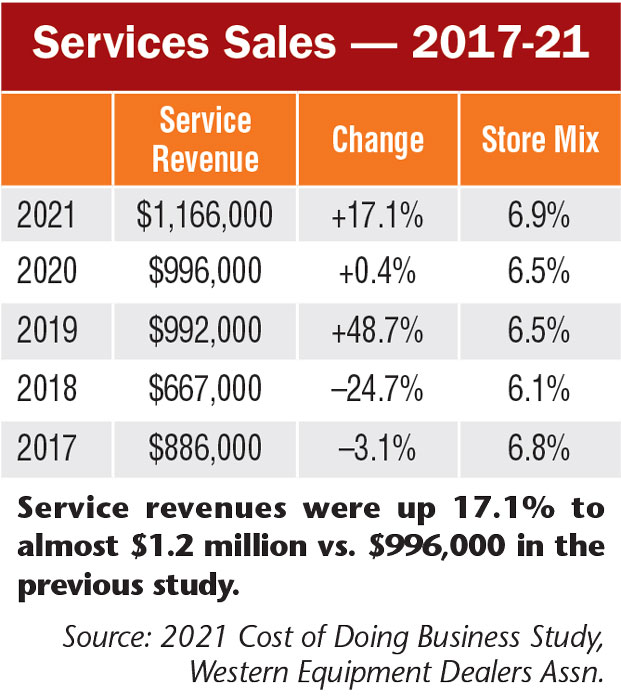
“This probably involved an increase in staffing,” says Thompson. “For store mix, our goal is 10%, and we’ll have to work to get there, but we’re moving in the right direction. This is a major accomplishment.”
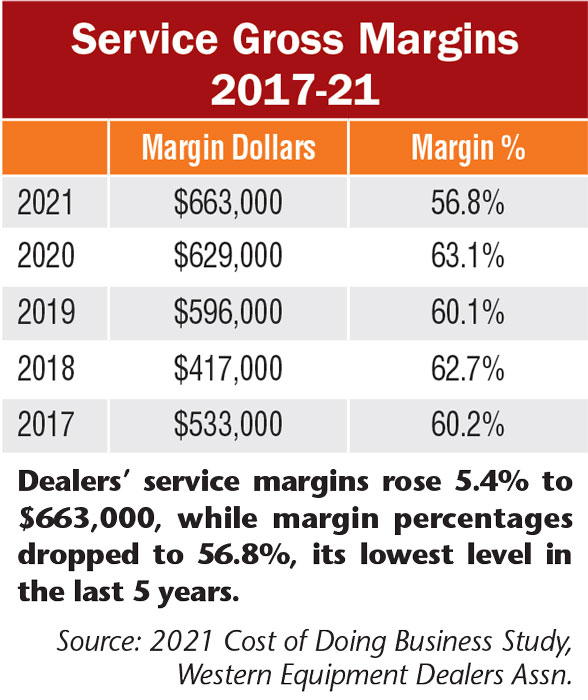
COVID Pushes Down Service Margins
Service gross margins, as opposed to service revenue, fell in 2020 to 56.8% vs. 63.1% in 2019. This was the lowest margin reported in the last 5 years. At the same time, however, average margin dollars per location rose to a 5-year high at $663,000, up 5.4% from $629,000.
Thompson refers to the decline in margins as an “industry-wide blip,” saying that while the industry target is 60-70%, and more is generally considered better, it can get complicated with labor pricing.
“Part of the concern on labor pricing is if you get too wild on it, you’re going to sell less, and you’re better off having a price volume mix that works rather than go for high price and super high service margins.
“It’s an anomaly, but when you think about the situation we went through with COVID-19 with people at home and customer concerns, we think this contributed to the decline in margins, because it was just not all billable time due to new processes and procedures.”
Kleoppel gives the example of a mechanic either contracting COVID-19 or being exposed to it needing to take 2 weeks away from work. “You’re paying for those 2 weeks, and they’re not doing any billable time. Plus, dealerships invested quite a bit of money with the new requirements that were litigated to make sure everybody’s safe. And some that might have gotten charged to the service or parts departments.”
Revenue per Employee Continues to Rise
Dealers reported an average of 22.6 employees per location, reversing the decline to 20.5 recorded in the previous report. Total revenue per employee rose 1.5% to $754,000 vs. $743,000. This was the third year of increase.
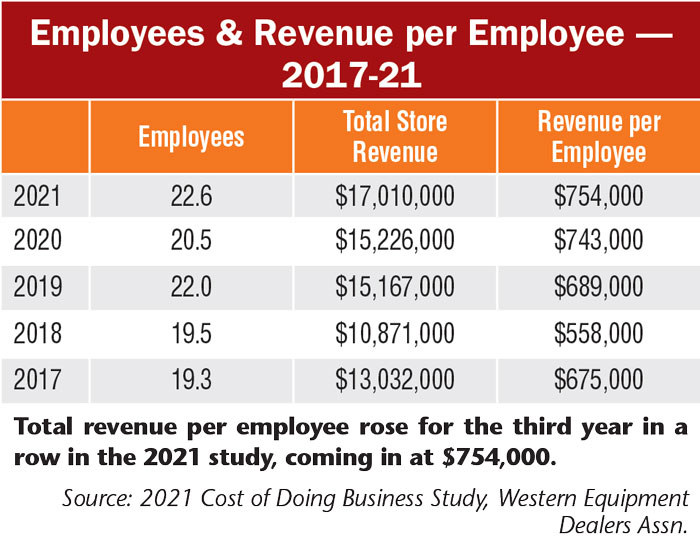
Thompson says while the industry goal is $750,000-$1,000,000, putting this year’s numbers just inside the goal, he considers it a step in the right direction. “The target is between $750,000-$1,000,000, depending on whether or not you’re a big dealer,” he says. “Most of our participants are big dealers. We would still like to see that number higher, but it’s in the right direction.”
By dealership size, gross margin per employee was unchanged for the smallest dealerships but declined for mid-sized (down 20.4% to $125,000) and larger dealerships (down 29.5% to $160,000).
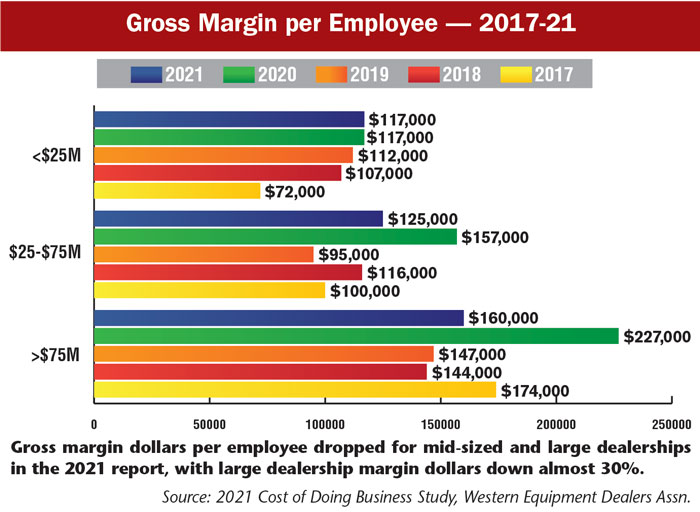
“As you can expect, you tend to see more sales and more gross margin in the larger dealerships,” says Thompson. “Some of these numbers are lower, but I think last year’s report was quite a bit higher than normal, so we’re about where we would normally be. I’d say these are good numbers.”
“I would agree,” adds Kleoppel. “In the 2020 study, especially for high-volume dealers, the gross sales were tremendous, so that’s what drove that number up in last year’s report. Plus the employees were down too in that year.”
Profits More Than Double
One of the most notable increases in this latest report was a 107.6% increase in the average profit from operations reported per dealership, coming in at $492,000 vs. $237,000 in 2019. This represents a 530.8% increase from the $78,000 in profit reported in the 2017 study. Profit as a percentage of revenue rose to 2.9% in the most recent study, a 5-year high.
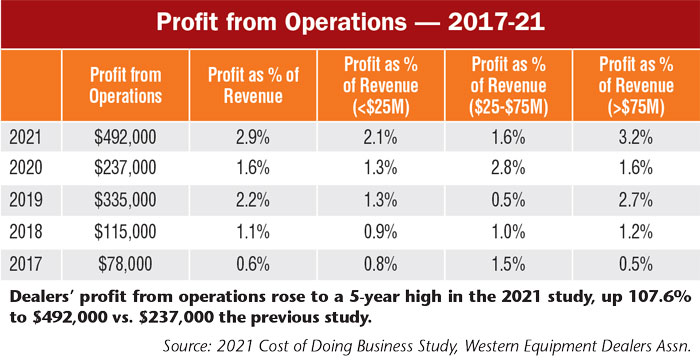
“We’re looking at a target of greater than 4% operating profit,” says Thompson. “We’re pretty low in the mid-sized
category, but that group seems to fluctuate a lot, and it’s hard to predict. But when we look at the totals, I would call it a very successful year.”
Expenses Up Slightly
Dealers reported an average of $2,278,000 in expenses per location in the most recent report, up 2.6% from $2,221,000 in the last report. Expenses as a percentage of revenue, however, was at its lowest point in 5 years, down to 13.4% from a peak of 15.5% in the 2017 report.

“This is a great accomplishment, because there was cost incurred due to COVID-19, and there were things done that added to our expenses,” says Thompson. “That decline in expenses as a percentage of revenue is going straight to the bottom line. This is a really good outcome and the best probably in a long time.”
Kleoppel adds that while most things cannot be controlled, expenses can, and while the 2021 report didn’t hit the industry goal of under 12.5%, he thinks the next report might see that goal met. “Especially in the higher volume dealerships, some of those guys are operating at 10% operating expenses, so I think we’ll see this start to come down some.”
Dealers Report Improved Returns
For 2020, dealers reported a 25.7% return on equity, a notable jump from 16.4% in last year’s report and over 3 times the 8.6% reported in the 2017 report. Return on assets reached 8.3%, also surpassing the 5.1% in the previous year and over 3 times the 2.6% from the 2017 report.
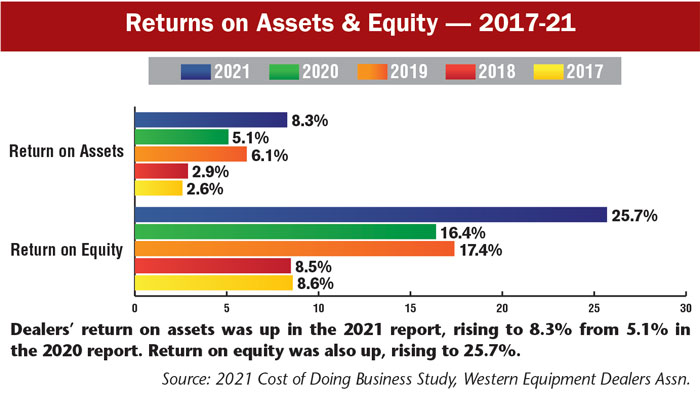
Thompson says he is once again impressed with the results, noting the industry is close to reaching its industry goal of 10% return on assets. He notes that while overall equity increased for dealers in this year’s report, which tends to downplay return on equity, it still rose. “We haven’t seen levels like this in a decade or so, so these are exciting levels. It gets you excited about going to work.”
Absorption Reaches 73%
Dealers reported an average absorption rate per location of 73.2%, the highest recorded in the last 5 years and almost 10 points above the 63.9% reported in 2020’s report. By dealership size, the smallest dealerships showed a slight decrease in absorption to 52.7%, while the mid-sized and largest dealerships reported increases, up to 67.3% and 76.5%, respectively.

“This is another great outcome,” says Thompson. “This is probably a record level. I was astonished to see a 10% increase in absorption for your average dealer, I didn’t know that was possible.”


