Most ag prognosticators agree that it would take a significant disruption to crop supplies to impact the prices of the major crops (corn, soybeans, wheat). With nearly all of the 2017 harvest in the bin, it’s readily apparent that this did not happen.
In fact, the national average per-acre corn yield is expected to come in at a record 175.4 bushels. The Illinois Corn Growers Assn. is reporting that this year’s state yield is approaching 198 bushels per acre, second only to the 2014 production of 200 bushels per acre.
The Nov. 9 World Agricultural Supply and Demand Estimates was considered a negative for corn prices. In his analysis of the report, Michael Shlisky, analyst with Seaport Global Securities, told investors, “Using this month’s WASDE numbers, we now project 2017-18 U.S. major crop cash receipts of $96.852 billion, down 5% year-over-year (from down 6% last month). On a calendar-year basis, our model suggests that overall cash receipts (major crops, other crops and livestock) will increase 3% in CY2017 but remain flat in CY2018.
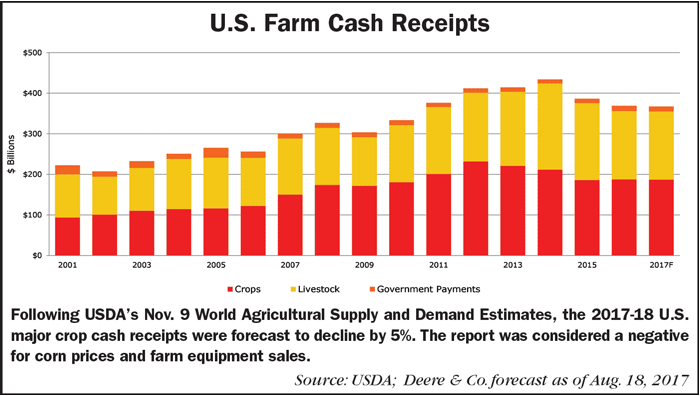
“Crop prices and ag equipment stocks reacted negatively to these U.S. crop headlines, as well as increased world ending stocks for both corn and soybeans. In our view, the all-time record yields for corn were a real surprise to the market. It underscores that negative headlines surrounding crop prices remain a risk into next year and points to only a moderate recovery for U.S. tractor and combine markets at best,” says Shlisky.
Ethanol Exports
One market that could hold some potential for increasing demand for corn and potentially help boost its price, as well as ag equipment sale, is ethanol exports. This budding market is covered in the report, “Global Ethanol Mandates: Opportunities for U.S. Exports of Ethanol and DDGS,” released last month by USDA’s Economic Research Service.
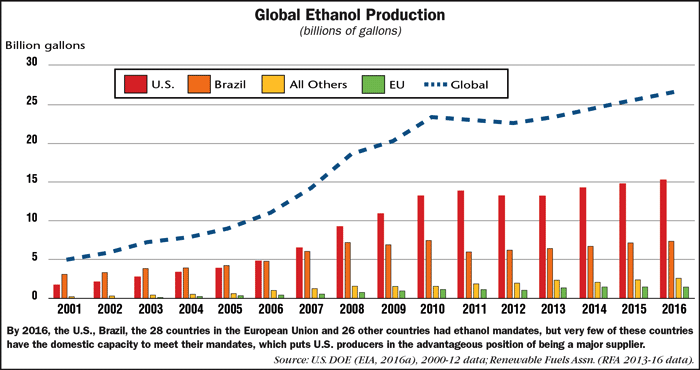
From 2001 to 2016, global ethanol production grew 400%, from 5 billion gallons to almost 27 billion gallons. Historically, the U.S., Brazil and the European Union (EU) were the world’s major ethanol markets.
“Prior to 2001, only Brazil and Paraguay had ethanol mandates. Since then, the number of countries with ethanol mandates has grown considerably as governments adopt the policies to promote energy independence and for other economic and environmental reasons. By 2016, the United States, Brazil, the 28 countries in the European Union and 26 other countries had ethanol mandates,” say the authors of the report.
“Most recently, some African countries have instituted ethanol blending mandates, ranging from 2% in South Africa to 15% in Zimbabwe. Additional countries have ethanol blending targets, while others use ethanol without an official requirement.”
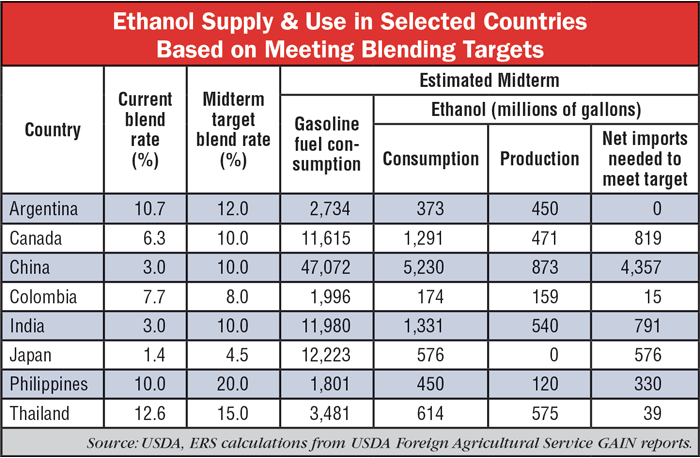
The growing importance of other countries in the global ethanol market highlights the need to better understand their capabilities of meeting mandates with domestic production and their need for imports. The increase in mandates presents strong and diverse export market opportunities for U.S. ethanol, according to the report.
U.S. Ethanol Production
Very few of these countries have the domestic capacity to meet their mandates, which puts U.S. producers in the advantageous position of being a primary supplier. But the amount of ethanol available for export depends largely on how much ethanol is produced beyond that required to meet the U.S. Renewable Fuel Standard mandates, according to the report.
“To date, U.S. ethanol production has been fairly resilient, due largely to low feedstock costs and favorable biofuel policy. It is likely that lower gasoline prices could, over time, discourage ethanol plant-capacity expansion and dampen the availability of ethanol for export in the medium or long term.”
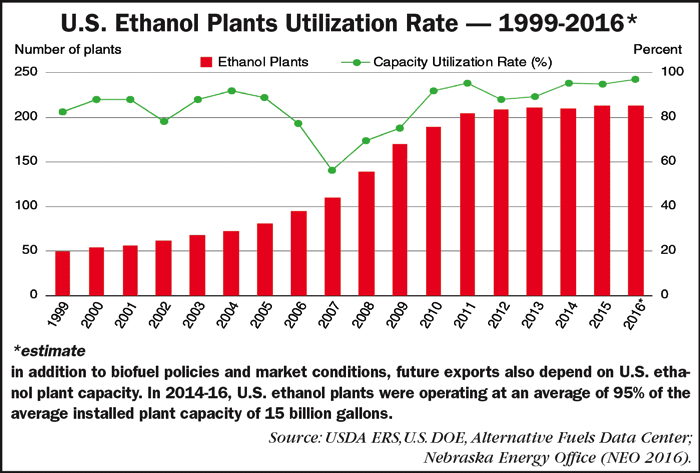
The report goes on to say that, in addition to biofuel policies and market conditions, future exports also depend on U.S. ethanol plant capacity. Plant construction has slowed since 2011; however, the utilization rate has remained high, averaging 92% from 2011-15. In 2014-16, U.S. ethanol plants were operating at an average of 95% of the average installed plant capacity of 15 billion gallons. In 2016, production totaled 15.33 billion gallons, while consumption was 14.54 billion gallons. After accounting for stocks, imports, and actual use, approximately 1 billion gallons were available for export, an amount larger than previous annual export levels with the exception of 2011.”
The Role of DDGS
In addition to ethanol production, about one-third of the grain used to produce ethanol returned to the market as distillers dried grain with solubles (DDGS). The large increase in U.S. ethanol production led to an upsurge in DDGS production, which grew from 10 million metric tons in 2005 to 38 million in 2016. A bushel (56 pounds) of corn used in dry-mill ethanol production generates about 17.4 pounds of DDGS. In 2015, 54% of domestically consumed DDGS was fed to beef cattle, 34% to dairy cattle, 7% to swine and 5% to poultry.
Growth in ethanol production limits the volume of DDGS that can be used in feed, and favorable export markets led to increases in U.S. DDGS exports. In 2005, 12% of DDGS produced in the U.S. was exported. By 2015, the share had grown to 31%. In 2005, the EU consumed 39% of U.S. DDGS exports. In 2006-10, Mexico generally acquired the largest share, followed by Canada. China became the largest importer in 2011 and has remained so, accounting for 46% of U.S. DDGS exports in 2015.
DDGS Exports
Overall, exports of DDGS went to 50 countries is 2015 and more than 70 countries over the last 10 years. According to the ERS report, if an expansion in ethanol exports resulted in an expansion in ethanol production, all else being equal, the amount of DDGS produced would also increase. For example, a 1 billion gallon increase in ethanol production would lead to an additional 2.77 million metric tons of DDGS.
The domestic potential for DDGS consumption based on 2010 livestock numbers is between 35-55 million metric tons. In addition, researchers note that potential exports range from 20-52 million metric tons. In 2015, 26 million metric tons of DDGS were consumed domestically, and 12 million metric tons were exported.
The U.S. has found export opportunities for DDGS in countries beyond its traditional partners. In particular, South Korea and Vietnam have increased their imports of U.S.-produced DDGS. South Korea more than doubled its imports from 2012-13 to 2015-16, from 376,000 metric tons to 845,000 metric tons; Vietnam, similarly, doubled its imports in 2 years to become the third-largest destination for U.S.-produced DDGS in 2015-16.
Solid Growth Potential?
While most U.S.-produced ethanol is consumed domestically, the country exported 1.05 billion gallons of ethanol in 2016, the second-highest amount on record. In 2016, production capacity at U.S. plants was almost 16 billion gallons, about 1.6 billion gallons more than 2016 domestic consumption.
The report concludes that as domestic consumption is constrained by the blend wall, (the physical limit to how much ethanol can be blended with gasoline) as well as by the limit on the amount of corn-based ethanol that can be applied to the ethanol mandate, ethanol producers have found abundant export opportunities.
In 2015, U.S. ethanol was exported to more than 50 countries, and in the past 5 years, more than 100 countries have imported U.S. fuel ethanol. If major economies start implementing their existing target blend rates, U.S. ethanol producers would have much larger foreign market opportunities, as domestic production in some countries will not be sufficient to meet the required ethanol levels.
Ethanol Politics
Ethanol is a political football in the U.S. as big oil states vie with big ag states for advantage. This should not be discounted internationally either.
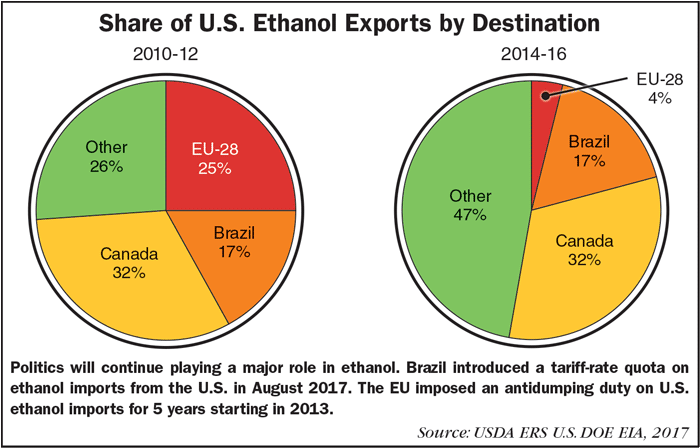
Canada, Brazil and the EU have been the main importers of U.S. ethanol. Today, Canada continues to be the leading destination with a 32% share in 2014-16. At the same time, Brazil introduced a tariff-rate quota on ethanol imports in August 2017. In 2016, the U.S. exported 267 million gallons of ethanol to Brazil; however, the TRQ would apply a 20% tariff on imports above 159 million gallons. And, after the EU imposed an antidumping duty on U.S. ethanol imports for 5 years starting in 2013, U.S. exports to the EU fell from a 25% share in 2010-12 to around 4% in 2014-16.