In this part of the special report, the Western Equipment Dealers Assn. (WEDA) provided an analysis of finances and operations of a hypothetical dealership named Brookfield Farm Equipment, or BFE, using the 2014 Cost of Doing Business study for comparison purposes. This particular dealer would fall in the larger group of dealers with more than $75 million in annual sales.
Balance Sheet
Taking a first look at the BFE balance sheet (p. 78), Kleoppel says, “Their cash position is not as good as what the industry is showing, but it’s somewhat offset by accounts receivable.”
The peer group has 3.2% of their total assets in cash while BFE is at 2%. Further analysis shows the large figure in factory receivables, which is likely volume bonus that hasn’t been paid. Contracts in transit is also a hefty figure and should represent year-end sales that are completed, but not yet funded, at least on the statement.
Kleoppel witnessed large numbers such as these in 2014, as year-end purchases were late due to inactivity by Congress regarding the section 179 tax code provisions. Most, if not all, of the factory receivable dollars will end up in the cash number, dramatically improving its percentage. The contracts in transit dollars will be settled after the end of the year, improving floorplan payables. By knowing what the numbers represent, the cash position is likely not a cause for concern.
This dealership would seem to have an excessive amount of machinery in its floorplan N/P section, but that’s partially due to the way they classify their vendor floorplanned equipment. The study shows those values in accounts payable and floorplan N/P, but BFE displays all in floorplan N/P.
Kleoppel says, “You have to combine those two numbers in the study compared to the floorplan N/P in the sample dealership. The industry average is $15 million in floorplan and $13 million in accounts payable for a total of $28 million, which is much closer to the $38 million total for the sample company. They still need to reduce their inventory to a more manageable level.”
Looking at the equity position, BFE is below its peers by almost 5%, which is a cause for concern, although when comparing it to 2013 numbers, they’re showing improvement. Kleoppel says it’s important for dealers to realize changes in business practices take time and percentage increases from year-to-year mean the needle is moving in the right direction.
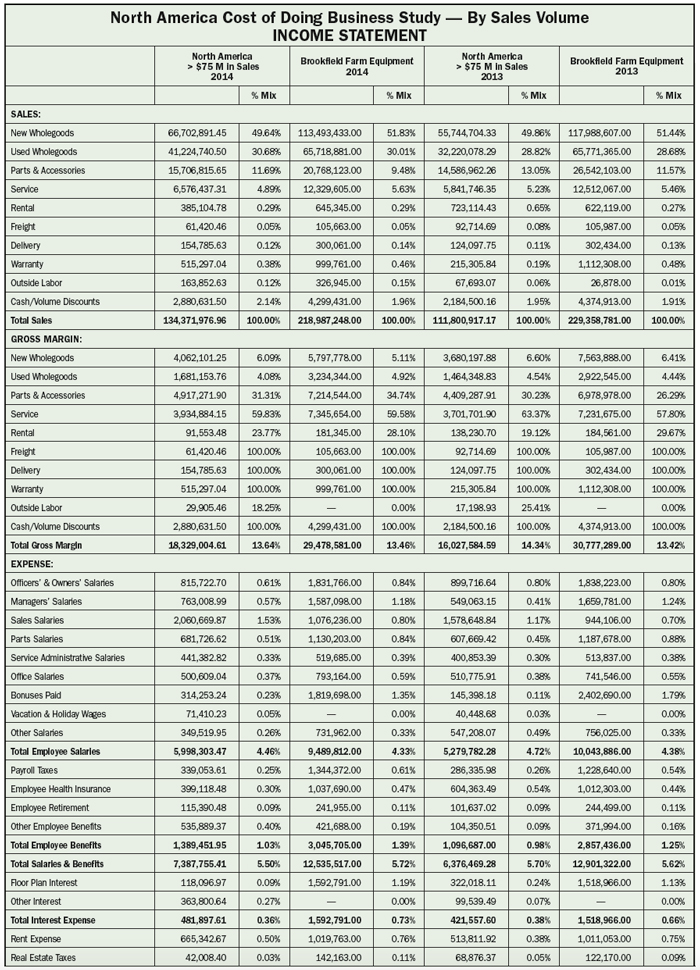
Income Statement
“Looking at the income statement (p. 80-81), BFE is holding its own with industry averages in most areas,” Kleoppel says.
However, their total expense dollars, as a percentage of total sales, seems high. Further analysis shows seemingly large expenses for sales car & truck and advertising & demos. The former could mean they have a larger sales territory than their peer group, or they’ve updated their fleet. It could mean someone is abusing a privilege. A closer look is definitely warranted. The latter should be analyzed to make sure advertising dollars are being wisely spent.
The floorplan interest expense confirms a problem. BFE’s numbers are high with twice that of the peer group, which indicates that inventory reduction should be a priority. Their interest expense is also up from the previous year at the dealership and represents an area for potential improvement.
While the lost warranty number of over $1 million seems to dwarf the peer group and demand immediate attention, Kleoppel says it may not be what it appears. It could also be the sign of an extremely aggressive warranty administrator who is attempting to recover large amounts of dollars. When the claims are only partially filled, it inflates the number. Further inspection would be required to determine if the problem is real.
“The large dollar figure in depreciation,” Kleoppel says, “probably means the business is taking a more aggressive depreciation schedule for tax purposes vs. other dealers.” The also have a high number in commission expense that could indicate a transition to performance-based pay that is allowing top employees to earn premium wages.”
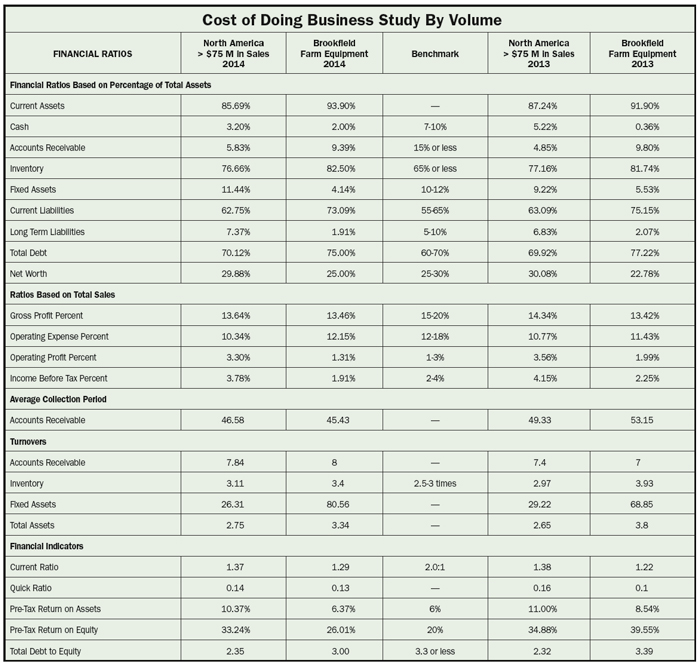
Financial Ratios
The ratios sheet (p. 84) summarizes key performance indicators from the other financial reports. It mirrors the numbers that show this dealership to be a little high on inventory dollars, but Kleoppel admits, “Their turns on inventory is actually a little better than the rest of the industry.”
Accounts receivable to total assets appears high and above the benchmark. But, BFE’s average collection period is comparable to the industry and collecting doesn’t seem to be a problem, so it raises little concern.
BFE should improve its pre-tax return on assets, which is pre-tax net income divided by total assets and pre-tax return on equity, or pre-tax net income divided by total equity. Both are above benchmark numbers, but lag the industry and are below numbers for the previous year. Again, inventory reduction would help both figures.
The bottom line for BFE is they should work to better manage inventory, which would reduce their payables and increase their equity. Otherwise, they’re doing reasonably well.