Forecast vs. Actual
Our database for tractor retail sales and field inventory is derived from AEM’s monthly Flash Reports.
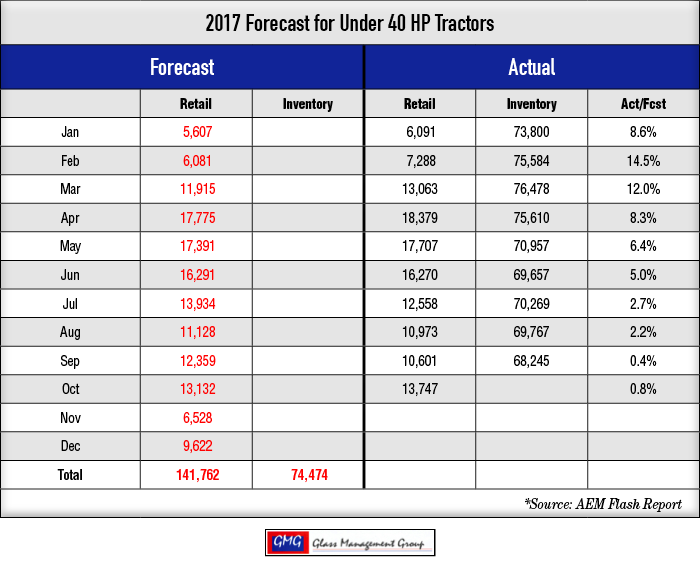
Under 40 Horsepower Tractors — October sales for these small tractors came in slightly ahead of our monthly forecast and the year-to-date totals rose slightly to 0.8% above our original forecasted totals.
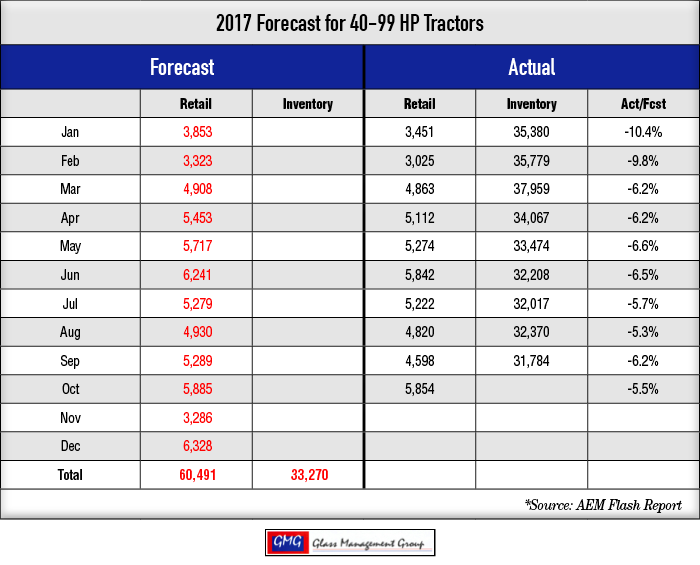
40 to 99 Horsepower Tractors — The monthly totals for this category came in just 31 units under our original monthly forecast and the year-to-date total retail sales were under our forecast by –5.5%.
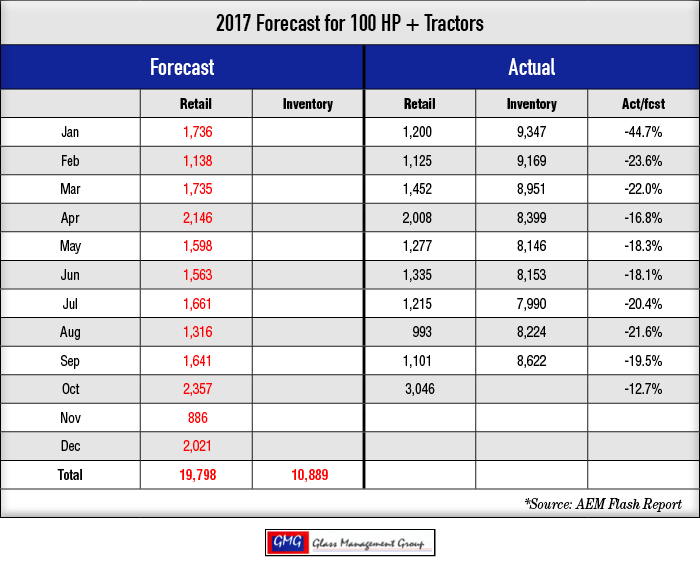
100 + Horsepower Tractors — Retail sales in this category boomed in October and was nearly 700 units above our monthly forecasted volume. The year-to-date total retail sales continue to creep closer to our originally forecasted amounts as the month finished at –12.7%.
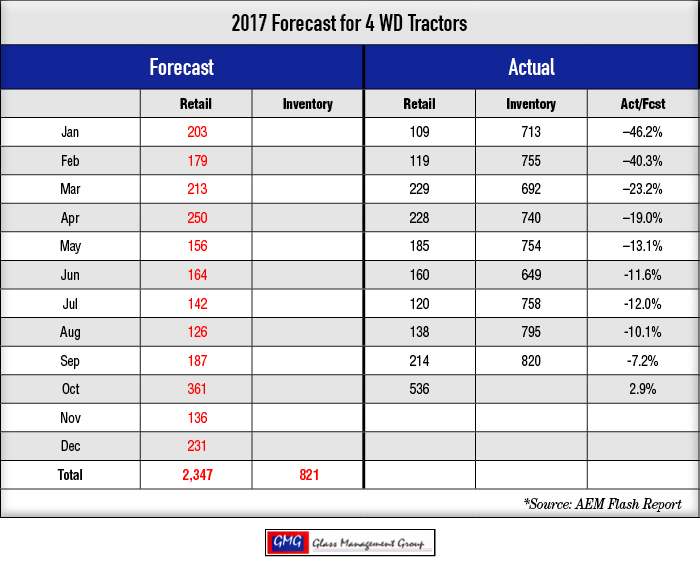
4 WD Tractors —Sales of the largest tractor category enjoyed a tremendous month with nearly 170 units more than our monthly forecast. These year-to-date totals finished very close to our year-to-date forecasted totals at +2.9% over forecast.
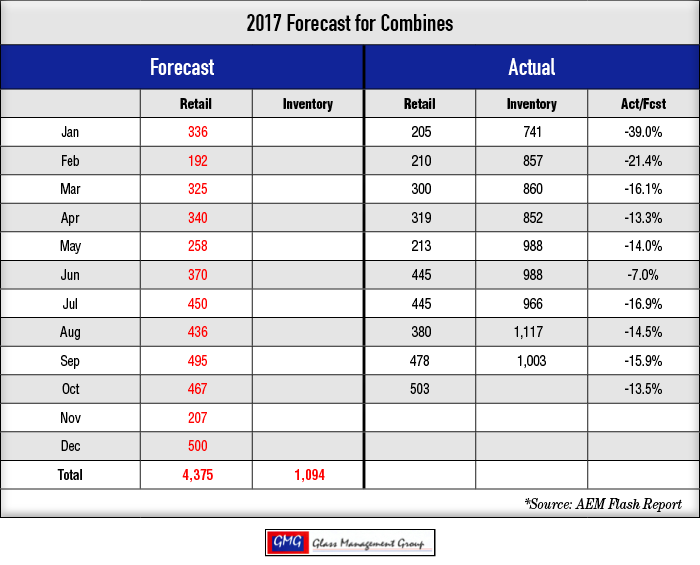
Combines — Retail sales of combines for the month exceeded our monthly forecast by 36 units but the year-to-date totals are slowly closing in on our forecasted total where we are now at –13.5%.
Our 2018 Forecast for Tractors & Combines will be posted on the Farm Equipment website early next week and will include a detailed explanation of our projections for next year.
What Really Drives Farm Equipment Purchases?
Net Farm Income
Our database includes net farm Income statistics from 1969 through 2016. Over the intervening years we have found conclusive evidence to show that the availability of cash with which to purchase farm equipment has been the principal driver. When net farm income is elevated, farmers tend to feel comfortable in their decision to purchase a new piece of equipment for their operations. The decision to purchase a new tractor or combine may come from the fact that their current equipment is no longer as effective as it once were and the newer models offer features that were unavailable in the past. On the other hand, it could be that their accountant agreed that the purchase of a new piece of equipment would not only improve their farming operations but it would also help eliminate a portion of their tax burden.
Commodity Prices
Commodity prices for grain represent an income line item for grain farmers and an expense line item for livestock and poultry producers, and both have an impact on producers’ bottom lines. Grain farmers are dependent upon prices that have been established by some shadowy entity in Chicago, New York or other international market places to determine the success of their efforts. Farmers, in increasing numbers, are using the futures market to provide a hedge against their future sales, which helps to eliminate some of the uncertainty of the markets. Both producers and consumers utilize these hedge positions to provide some financial stability to their operations.
Currency Exchange Rates
The value of the U.S. Dollar vs. other world currencies certainly does not dominate the thinking of the average U.S. agricultural producer, but it has a significant impact on commodity prices and ultimately net farm income. Since approximately 30% of the U.S. grain crop is sold to export buyers, the currency exchange rate has a major influence upon the price of commodities domestically. From 2002 to about 2014, the U.S. Dollar sold at a significant discount to other world currencies and resulted in our commodities and other products being seen as a bargain by international buyers. We often view the strong dollar with a point of pride, but it does have a dampening effect upon commodity prices and export sales.
Government Activity
While traveling in West Texas in 1980, I walked into a dealer’s office to find a picture of Jimmy Carter hanging on his wall, neatly framed by a weathered, broken toilet seat. Carter’s 1980 Russian grain embargo was intended to teach Russia a lesson but we soon found that the dominant position we thought the U.S. held in food production was shown to be in error. It allowed competitors such as Brazil to gain a foothold in the export markets to the detriment of the U.S. The end result was a devastating effect on U.S. grain farmers. Worldwide government activity often limits our ability to sell commodities to those countries and that does exert pressure on prices here at home.
Population Growth
The current world population is approximately 7.6 billion people and the net gain in population is nearly 150,000 per day, so the need for foodstuffs continues to increase. The U.S. is a major producer of corn and soybeans while Brazil is nipping at our heels. This means that the bulk of foodstuffs are produced in the western hemisphere while the need for those products is in the developing countries across the world. This growing demand could positively affect commodity prices and U.S. producers’ income.
How Will This Affect 2018 Retail Sales?
Our forecasting models are suggesting that net farm income will increase by about 3% over 2016 levels this year and that certainly could suggest some upward movement in equipment purchases. The strength of the general economy has provided positive growth in the IRAs and 401Ks and has brought about a feeling of growth in businesses across the country. Most lifestyle farmers, the major purchasers of smaller equipment, feel more confident about their jobs, the future of their employers and have begun to see some increases in their paychecks, which afford them the opportunity to buy equipment for their farms.
Our tractor forecasting models suggest that the larger horsepower units and combines that are generally purchased by production farmers to be flat to down in 2017. Even though there is an increased projected in net farm income level for 2017, there is still some concern about the financial wisdom of purchasing new equipment at this time. Section 179 Bonus Depreciation capped purchases at $2 million and depreciation values at $500,000 but without a profit from their farming operations, most farmers will forego this option in 2018. Farm loan demands at the local banks have been declining in 2017 and the banks have begun to tighten their agricultural business loans due to weak commodity pricing. All of this is putting pressure on equipment sales in the near future.
Commodity Prices
The 2017 harvest is nearing completion with more than 80% of corn and 90% of soybeans in the bin as of Nov. 12.
Corn – Corn prices closed down about 10 cents below the September close and the crop size continues to appear to be rather large. December contracts closed at $3.74 per bushel while the March 2018 contract closed at $3.60 per bushel. A record harvest will continue to exert downward pressure on prices.
Soybeans – Soybean prices rose during the month of October and the November contract closed at $9.91, which is about a 45 cents gain on the September close. The January 2018 contract closed at $10.01 and was up about 56 cents above the September close.
Conclusion
2017 continues to appear to be a base-building period and, while large tractors are woefully below our original forecast, there is some evidence that they won’t go much lower in 2018. The increase in net farm income in 2017 is certainly heartening but it does not appear to be enough to bring about a major increase in tractor and combine sales for next year.