Forecast vs. Actual
Our database for tractor retail sales and field inventory is derived from AEM’s monthly Flash Reports.
Under 40 Horsepower Tractors — Our year-to-date forecast for this category was slightly understated and the year ended with retail sales exceeding our forecast by 1.3%.

40 to 99 Horsepower Tractors — Our stated goal for forecasting is +/– 5% and this category ended the year just slightly behind that goal. We were optimistic in our forecast and the actual year-to-date retail sales were –5.9% below our original forecast.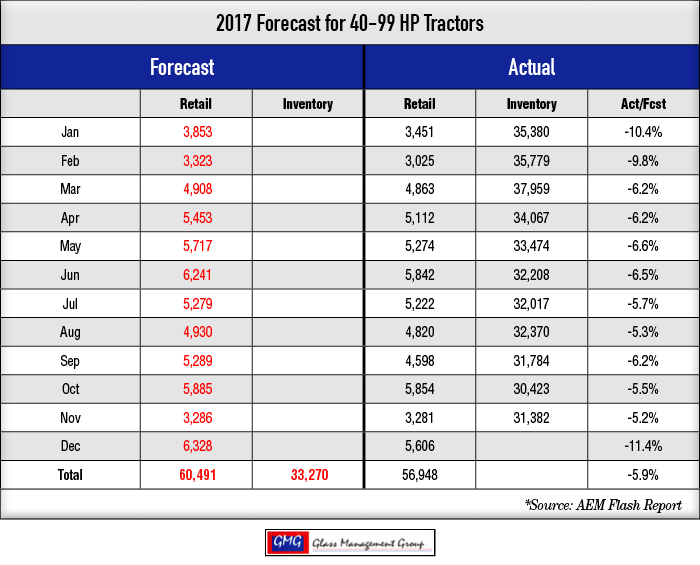
100 + Horsepower Tractors — There is no other way to say it — we missed this one! The actual year-to-date retail sales were 13.8% below our original forecast.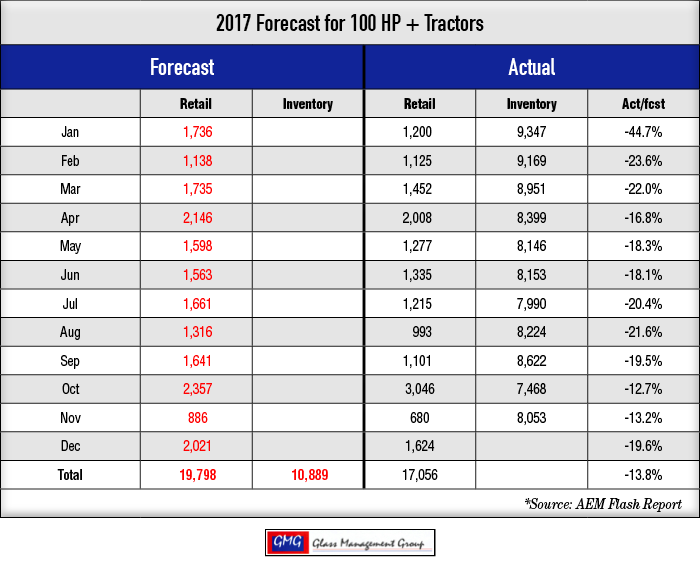
4 WD Tractors — This category closed the year with year-to-date retail sales at 3.5% above our original forecast.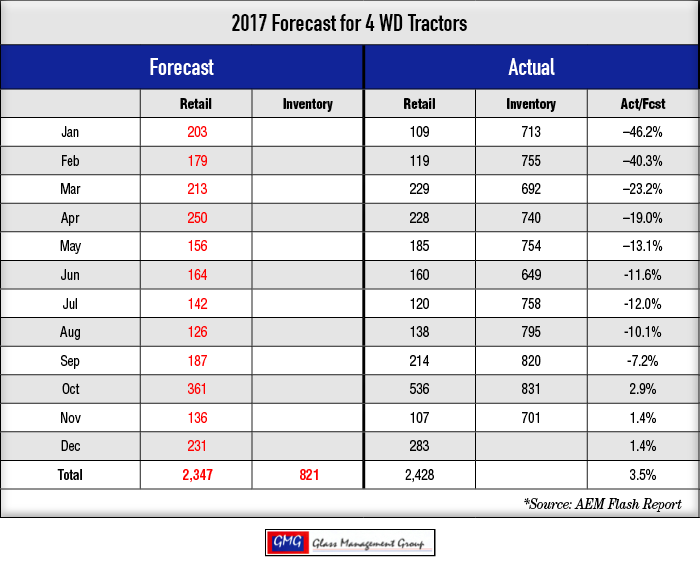
Combines — A solid sales month in December moved the year-to-date retail sales to within 4.6% of our original forecast. 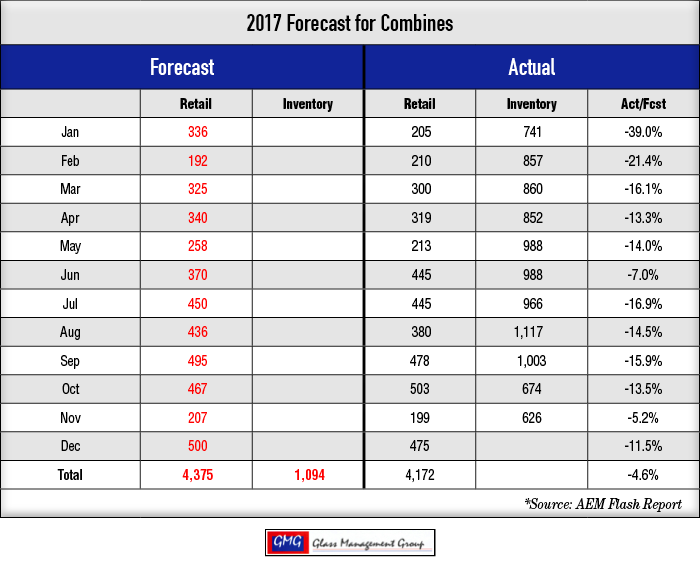
2017 in the Rear View Mirror
This past year was one that offers great promise for the general economy of the United States. For farm equipment dealers and manufacturers whose primary focus was small tractors, it was a very good year. Stock markets gained nearly 25% in value in 2017 while IRAs and 401K accounts blossomed, providing much comfort to their owners. Unemployment continued to decline each month and job creation continued its upward swing across the nation. The new tax bill enacted at the end of December immediately generated positive action within the economy with several large companies announcing pay increases and bonuses for their employees.
The agricultural economy typically lags the general economy by about 18 months. For those dealers and manufacturers whose primary products are purchased by production agricultural producers, it was not quite so rosy. 2017 did produce some positive signs for the agricultural economy and there is a strong indication that larger tractors and combines have reached their bottom for this cycle. The 4WD segment, which represents about 1% of the total unit sales in 2017, but about 8% of the total dollar sales, has shown some strength all year long. While it probably won’t make a huge change in 2018, it most likely will show a small increase in both number of units sold and in total dollars and could lead the larger tractor markets forward this year.
There are other positive signs on the horizon. There are fewer economies around the world in recession today than in the past decade. World population continues to grow and the demand for foodstuffs will certainly grow, also. In recent weeks, there are signs that the U.S. dollar is weakening against some of the major currencies and, should that trend continue, commodities produced in the U.S. will become even more attractive to purchasers around the world. That could have the effect of producing higher commodity prices for U.S. farmers and generating more farm income in 2018. All of this appears as a beacon in the distance and we probably won’t see the full effects until the fall harvest period.
Commodity Prices
Commodity prices are the lifeblood of much of the net farm income and those prices closed the year about $0.50 per bushel below our original forecast for corn. The data that we used to formulate our commodity pricing projections suggested that soybeans would close the year at $10 per bushel and it closed about $0.50 below that figure. While the corn prices probably did not generate a real profit, soybean producers most likely realized some profit from their efforts.
The U.S. Dept. of Agriculture’s 5 year forecast actually suggests that soybean acres planted will surpass that of corn in the near future.
Corn — The March corn contract closed the month at $3.51 per bushel and the May contract closed at $3.57 per bushel. Both were down from the November close.
Soybeans —The January contract closed at $9.56 and that was lower than the November close. The March contract closed at $9.64, and the May contract closed at $9.74.
Conclusion
2017 was a paradoxical year with jubilation in the small tractor camp with the larger tractor purveyors significantly less joyous. The under 40 horsepower tractor category represented about 64% of the total tractors sold in the U.S., but represented only about 22% of the total dollars produced. The next largest segment was the 40–100 horsepower category which produced about 25% of the total units and about 22% of the total dollars. That leaves an anemic number for the remainder of the categories and that has been the story of 2017.
There is a glimmer of positive expectation for 2018. 4WD tractors and combines seem to have found a bottom to their downward plunge and should remain at 2017 levels or slightly higher next year in the year ahead. At this time, the 100 horsepower category remains as the weakest for 2018.


