Forecast vs. Actual
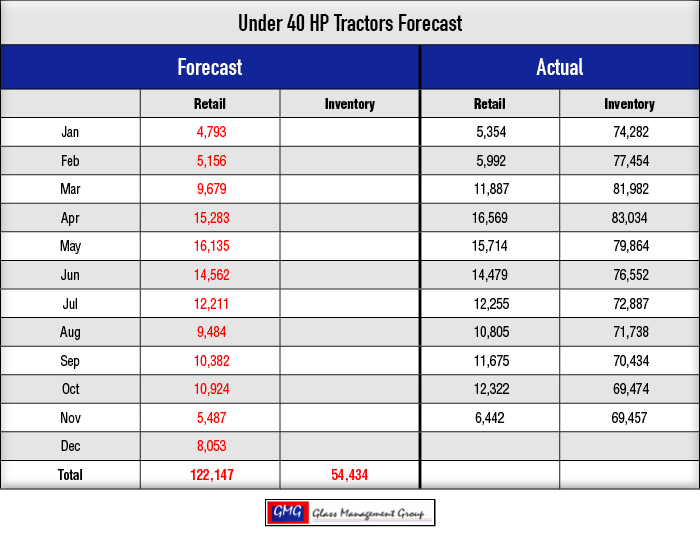
Under 40 Horsepower Tractors — This category continues to lead the way with strong retail sales during November. Even though it is only about half of the sales recorded in October, this November is nearly 1,300 units ahead of November 2015. Field inventory levels remained virtually unchanged from the October levels. Actual retail sales are 8.2% above our original forecast.
40 – 99 Horsepower Tractors — Sales for this category were again nearly 50% of October sales numbers, but was only about 141 units lower than November 2015. Field inventory level declined by nearly 1,500 units from the October level but remains approximately 1,200 units higher than the year ago totals. The actual retail sales results for 2016 year-to-date is currently 6.2% below our original forecasted numbers.

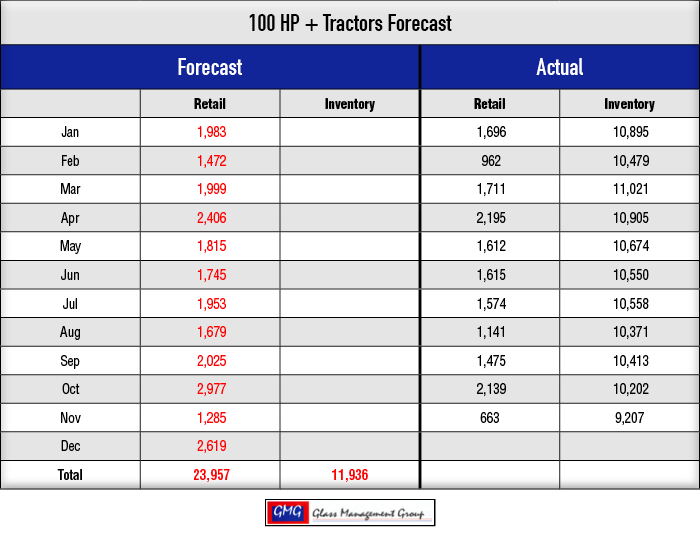
100 + Horsepower Tractors — Retail sales are down nearly one-third from the November 2015 totals and continue to be much below our original forecast. The field inventory level has fallen to under the 10,000 unit level and is approximately 500 units below the November 2015 results. The actual retail sales numbers are well below our original forecast.
4 WD Tractors — As retail sales slowed in November for this category, the field inventory level dropped below the 800 unit level once again. Our original forecast for this category is now 5.5% higher than the actual year-to-date results.

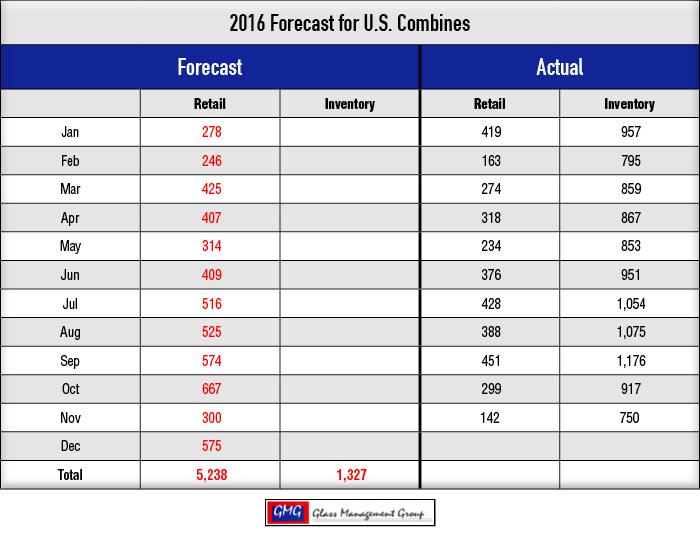
Combines — Combines continued to show weak sales activity during November while the field inventory level has dropped to its lowest point in 2016. Again our forecast is significantly higher than the actual sales activity and currently stands at -25.5%.
Bad News/Good News
2016 is shaping up to be a difficult year but there are some bright spots shining through. Net farm income for 2016 is now being projected to be $66.9 billion and that is 17.2% below 2015’s level. Added to that meager amount will be the income from crop insurance and other government programs that assist farmers in down years and that amount is currently expected to be $12.7 billion bringing 2016’s total to $79.6 billion.
These dismal numbers have created headaches for both dealers and manufacturers, but the bright spots are just ahead.
The USDA net farm income prediction for farmers who are engaged in the grain markets is actually moving higher. Corn, soybean, peanut and mixed grain farmers are expected to see a slightly elevated net farm income for 2016. Since these are the purchasers of most of the larger tractors and combines, it does indicate that there is a possibility of increased equipment purchases in 2017. Livestock producers have been facing a much stronger headwind in their segment of the agricultural economy and their equipment purchases will be somewhat subdued in 2017.
Median household Income for U.S. farmers is essentially unchanged from the 2015 level and remains at $76,839. That is a combination of both on-farm and off-farm income streams. Farm debt is up approximately 5.2% over 2015, but had been rising annually since 2011. An important data point is the debt/asset ratio of 13.2% expected for 2016. This ratio was around 12.5% in 2011 and fell slightly during 2012-2014, but began to rise again in 2015.
Farm debt is expected to rise over the 2015 level, driven primarily by real estate debt, but it has also been in a slow climb since 2011 and does indicate the conservative nature of the U.S. farmer during this past decade.
U.S. farmers continue to exhibit some financial strength and that should allow them to take advantage of any future buying opportunities that might arise.
Commodity Prices
December corn futures closed the month at $3.32 per bushel and that was down slightly from the October level. Even though input costs for corn producers declined slightly, these prices continue to be below the total cost of production.
Soybean prices rose slightly during November and the January 2017 contract closed at $10.30 per bushel. While these are not prices that will make the producer rich, they are above the cost of production.
Conclusion
Building consumer confidence after the election of Donald Trump as president has been seen in much of the economy in recent weeks. Should this trend continue into next year, it should have a positive influence on agricultural products and ultimately the sale of agricultural equipment. If the Trump administration is successful in the rebuilding of factory jobs, that will certainly be beneficial to our industry as well.


