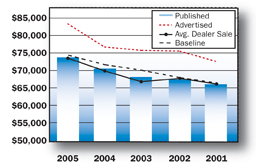
Fig. 1. Averaging raw values for the 160-169-hp tractors against a standard depreciation baseline factors in machine age, usage and model changes to arrive at a normalized value to make decisions with confidence.
Editor's Note: This new standing department was launched to provide dealers with insight and analysis on key trends in the industry's used machinery segment. With each installment focusing on a specific product segment, the content in this series is the result of discussions with the editors and analysts at IRON Solutions, who produce the gold standard data found in its Official Trade-In Guides. Please email mlessiter@lesspub.com with your comments on this new department and how Farm Equipment editors can make it of greater use to you and your operation.
This initial installment focuses on trends in 160-169-hp category of row-crop tractors. In the analysis of tractors in this horsepower range, the data sample includes 3,199 reported sales records over the past 3 years, including 1,152 in 2005, 1,008 in 2006 and 1,039 in 2007.
As the first article in the series, the process used to normalize the volume of data that is reported by dealers and auctioneers from across North America will also be described.
There are four key factors used in the matrix that is used to normalize the data — actual dealer reported sale price (net of over-allowance), auctioneer sales data, advertised asking prices and the selling price of a comparable new unit.
The accompanying tables and charts provide a glimpse of a subset of the data for advertised prices and normalized sales values for tractors in this horsepower category in model years 2001-2005. The values have been analyzed over a 3-year period, showing the depreciation of each, dependent on age when sold.
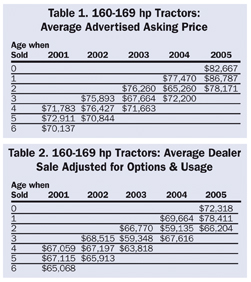
Asking Price. Table 1 shows the asking prices for this category of row-crop tractors. To arrive at these figures, editors monitor advertised prices, just as dealers do when scanning newspapers, ad shoppers or the Internet. This only conveys what the seller is asking for the unit, however, and can be misleading if not adjusted for optional equipment and attachments.
Actual Transaction Price. Table 2 shows you how these same units are valued by dealers when sold and adjusted for usage and options. Options are key when trading larger row-crop tractors.
For example, IRON Solutions lists 20 options for the John Deere 8210 tractor alone, totaling almost $50,000. The published advertised value of a 2005 model is $94,600. A dealer assessing unadjusted advertised prices could easily find variances of 30-40% for any given model. Incidentally, the options having the greatest impact on trade values of tractors in this horsepower class are mechanical front wheel drive, front suspension, power-shift transmissions, constant speed transmissions, GPS/autosteer.
Each report submitted is scrutinized by multiple analysts and all reported sales are measured for accuracy, compared to regional averages and normalized for optional equipment and hour usage. Units in poor condition and/or outside standard deviation limits are not included in the final averaging process.
As seen in the tables, the difference in values is more than just "asking price and taking price." The difference varies 7-20%. One of the key explanations behind such a variation is a trade value established on emotions or inexperience.
This can lead to buying a trade-in at too high a price. When this occurs, the unit is subsequently advertised at a high price in hopes of recovering from the mistake. Market volatility is real and overpriced machines eventually sell only for what they are worth, which demonstrates how a 20%-plus spread can be seen between advertised and sold prices.
Depreciation Baseline. Another step is still required in the process. All raw averages are compared to and weighted against a standard depreciation baseline, which uses the current new selling price of a comparable model and applies a depreciation schedule (based upon 20-plus year history) that factors in machine age, amount of use and model changes.
This allows a measurement of the deviation of each model-year average, and also allows dealer reports to impact the published values depending on the activity in each of the seven North American regions.
This step of the process is illustrated for the 160-169-hp class tractors in Fig. 1. This final step can provide dealers with the normalized values that allow them to buy, sell and finance used equipment with confidence.
The Bottom Line. Even though the row-crop tractor market is strong, the variation in the advertised price and the actual selling price indicates there is still considerable volatility in the market. In many cases, dealers and salespeople are willing to seek out the data to support the valuation they need to make a deal. Assessing advertised prices (from print and web ads) is only one component in assessing the market value of a used piece of equipment, and by itself, it's the least dependable.
To determine the true value, one needs to know what price dealers and/or auctioneers are actually selling the machine for, including the hours and options on the piece of equipment.


