
Our industry is cyclical in nature, and what goes up must come down. So how do we prepare for a cycle that we know cannot continue?
The best time to prepare is before we see the market turn. Our dealerships are on strong financial ground now — probably as good as they have been. But the downturn in 2014 caught a lot of us off guard, and many of us were reactive. As quickly as that change came, the next one could come as well.
Winston Churchill said that those who fail to learn from history are doomed to repeat it. I hope we have all learned something through the last cycle and we're ready to do things slightly differently this time. I'm not sure if our manufacturers did, but I hope we as dealers have learned something. It's not a matter of if there's going to be a downturn at some point, but when. And so will we be ready?
Being Prepare for the Next Downturn
What will be different this time around? Used inventory levels will be different. From 2010 to 2013, we continued to ramp up sales and used equipment levels. When the downturn came in '14, we were loaded with inventories. We've come from a different environment where we've had supply chain constraints in this cycle. Inventories are starting to grow, but they're nowhere near where they were when they went down the last time. If you were around in those times, you remember what was going on with leasing with the manufacturers. It doesn’t matter what color you are, tractors were being leased at crazy rates and with short terms. All those lease returns came back to the manufacturers and ultimately they made their way onto our lots. And so not only did we have the used inventory on our trades to absorb, but we also had all the manufacturer's lease returns that they pushed back on our lots.
Mike Hedge, CEO, Birkey’s Farm Store
A training primer from Farm Equipment referred to Mike Hedge as “the best financial mind in the entire farm equipment industry.” An “evangelist of balance sheet management,” Hedge is known for a unique ability to connect financial principles to employees across a spectrum of disciplines and backgrounds. Hedge joined Birkey’s Farm Store as chief financial officer in 1992 and assumed the president/CEO role as part of a planned succession in January 2013. In 2023, Birkey’s succession continues as Hedge brings in the next generation while continuing as CEO and board chairman.
Inflation is something we haven't dealt with. I'm not sure how that is going to impact this next cycle, but we know that these price increases have continued to drive prices of equipment up. Trade differences are high and values are high. When we see values start to go down, we probably are not going to see a decrease in the manufacturer's new prices. We’re going to see large trade differences. While I'm not sure what's going to go on with inflation, I am sure it’ll have some effect.
Finally, we’re dealing with high interest rates. The one thing that saved us in the last down market was the fact that we were paying probably sub 2% interest on floorplan. If you get to a market where we’re selling our used equipment in a soft market at 2% gross margin, the carrying cost for a year, that margin would cover that. At 8% interest, if we get back to that mode of selling equipment at 2%, we’ll be underwater in a quarter. It’s going to become extremely important that we are proactive with turnover as the market softens to not get in the shape that we were in with used turnovers, and many of us probably had turnovers that were in the ones back in 2014 and 2015.
There are 3 things I’m going to focus on in the rest of this article:
- How our basic financial statements fit together and what they measure.
- What the key metrics are to monitor to help you understand the health of your business
- How to manage some of those metrics to mitigate the negative effects that may come in the next ag cycle.
Income Statement Balance Sheet
Most of the metrics we look at come from two major financial statements — the income statement and the balance sheet.
The income statement gives us one perspective of the health of a business and that's profitability. In many businesses the income statement is the only statement that really gets looked at. We want to know what the sales are, we want to know what the gross margin is and ultimately the profitability of the business. But it doesn’t tell us the whole picture of a company’s financial health because it doesn’t report on the company’s assets, liabilities and equity. Plus, it doesn’t report on any cash movements or whether we’re generating cash in our business.
While its important, we need to look at the other major statement — the balance sheet — along with the income statement. The income statement reports on selling activities for a specific period of time. Sales, less cost and expenses equals our income. The balance sheet, on the other hand, covers the basic equation of accounting — assets minus liabilities is equal to equity. Assets are basically what we have. Liabilities are what we owe to an outsider. Equity is the money that an owner has left in the business.
I like to use this rearranged equation because I think it’s easier for non-accountants to understand.
Assets (Have) = Liabilities (Owe) + Equity (Owner Investment)
In other words, what you have is owed to somebody. It's either owed to outsiders (e.g. the bank, the captive finance company, etc.) or it’s owed to the owners of the business who have retained their equity in the business. Assets are what we have — cash, receivables, inventory, prepaid assets, fixed assets. Examples of liabilities are accounts payable, accrued expenses, floorplan notes, short-term borrowings and long-term debt. Equity is the value to the owners such as capital stock and retained earnings, including historical profits that owners have left in the business as a means of financing it.
While the income statement presents the financial picture over a period of time, the balance sheet provides the financial picture of an enterprise on one particular day. It presents is what the business has today (assets), what the business owes today (liabilities) and what the business is worth today (equity). So many of our most crucial metrics of the overall health are used in calculating ratios that use both the income statement and the balance sheet. The challenge for us as dealers is to give the same level of attention to that balance sheet that we give to the income statement.
If you don’t come from an accounting background, you might not always know what you’re looking at or what the balance sheet tells you. If we boil it down to some basics, we can get store managers or sales management people throughout our organizations to understand why we make some of the decisions we do in our businesses for the health of our businesses.
Rolling 12-Month Review
When looking at these metrics, we need to go beyond our month-to-date and year-to-date numbers. I like to look at rolling 12 month income statements. It helps us track profit for the most recent 12 months. When you stack those month by month by month, you begin to see the trending of what’s going on — whether your sales are increasing or decreasing, whether your margins are improving or deteriorating. And it lets us know a lot of directional information about the business that we can't always see in a snapshot of a month-to-date or a quarter-to-date or a year-to-date.
The rolling 12 smooths out the seasonality of the business, and it helps calculate ratios and spot trends. It also lets us compare these metrics every month and over time. We learn a lot as we look over a long period in the business. Those of us who have tracked some of these metrics over the period of years begin to get a sense of where the balance sheet's going and what the risks are.
If we're going to track this, the several things I think are necessary but sometimes lacking in dealerships are good monthly cutoffs, very consistent accounting treatment, and a reporting package that is robust and has the appropriate amount of information.
Liquidity & Leverage
What should be our focus if the market softens, or if it moves toward a downturn? Liquidity – the efficiency or ease with which an asset can be turned into cash without losing value. I want to look at liquidity from a 50,000-foot view — how do we recognize it, how do we manage it, and what moves the needle in regard to liquidity in our business.
The problem we have is that inventory is not the same as cash, and it cannot be turned into cash very easily. If we understand this, and we make decisions to turn the inventory more quickly, we can convert those items to cash without losing as much value.
We also manage liquidity by managing our leverage. Leverage is a measurement of how well our business is capitalized and what the relationship is between internal financing and external financing to support the assets of our business.
Those assets are financed somewhere — either by internal financing or external financing. That internal financing is the capital and equity. External financing comes from the bank or an outside party, which is riskier than retaining earnings in the business and financing your business via owner investment.
To assess the risk of external financing, we can look at 2 leverage ratios on our balance sheet. One leverage ratio is called financial leverage — assets divided by equity. The other way to look at leverage ratio is debt to equity, which is a ratio of the liabilities to the equity of the business — in other words, how many dollars is the bank and captive financing in relation to the amount of money the owner is financing? Leverage is important because it measures what kind of stability we have in our business and the quality and source of this financing.
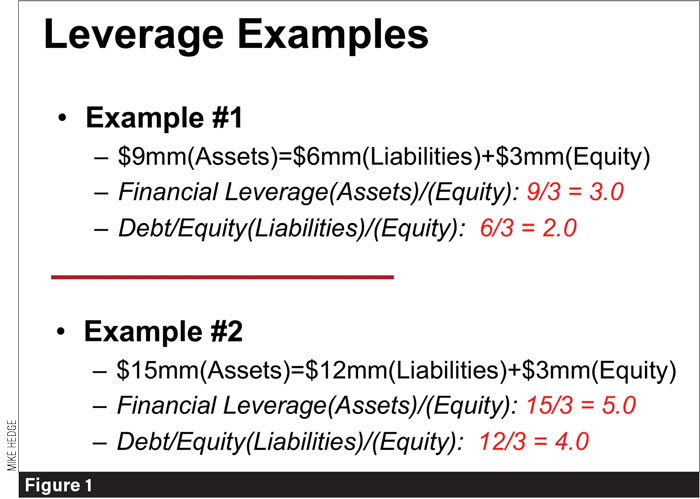
I’m going use a very basic balance sheet to give a couple examples of leverage to show how it's calculated and what it means. In example 1, this dealer has $9 million of assets, has $6 million of liability and $3 million of equity. So our financial leverage would be the assets (9) divided by the equity (3) gives us a financial leverage of 3.0. Just by using basic algebra, the debt to equity is always one point less than the financial leverage.
On the debt to equity, we have $6 million borrowed from outside parties and $3 million invested borrowed from the owners. So the debt to equity is 2. Our consultants would tell us that's a good leverage ratio. If we ask them what the optimal leverage ratio is, most are going to say financial leverage of 3 debt to equity of 2
And of course our manufacturers also have standards, and they probably very similar. If you’re in the high horsepower market with combines and tractors, likely if you have a balance sheet that looks like our example, two thirds of that $9 million is inventory. Likely, $6 million of the $9 million is tied up in inventory.
In example 2, we have the same amount of equity, but now we have $15 million of assets and $12 million of liabilities.
In this case you do the math and the financial leverage is now 15 divided by 3, the assets divided by equity is 5 and therefore, the debt to equity is now 4. This is exactly the kind of thing we saw happening on a major scale on our balance sheets when we went from great times in 2013 to a terrible situation in 2014. Inventory ballooned as in this example and maybe out of that $15 million, $12 million now is inventory. Of that $12 million of liabilities, most are floorplan financing. Now the banks are a little less comfortable in this scenario.
The banks are a little less comfortable because we’re borrowing $4 from the bank for every $1 the owners have left invested in the business. Their question is going to be “what are you going to do to fix this?”
Our challenge as the industry softens is, how do we not go from example 1 to example 2?
Used Inventory Turns
The biggest driver of leverage is inventory. We must figure out what we’re going to do with inventory. One of the first things as an organization you have to do is understand inventory turnover. In the simplest form, it’s the number of times you can sell through your inventory in a year. You sell 4 combines in a year, you stock 1, you’ve got a 4x turnover.
You should be tracking new and used inventory turnover and look at it on a regular basis. It’s also important to track inventory turnover by product line. Can you stratify inventory by product line and model year in your dealership? This summer when I looked at our used inventory turn for combines, units from 2018 and earlier were at about 8.3x turns. But, combines from 2019-22 we're turning at about 2.5x. Having such information allow us to specifically target our actions to address our issues.
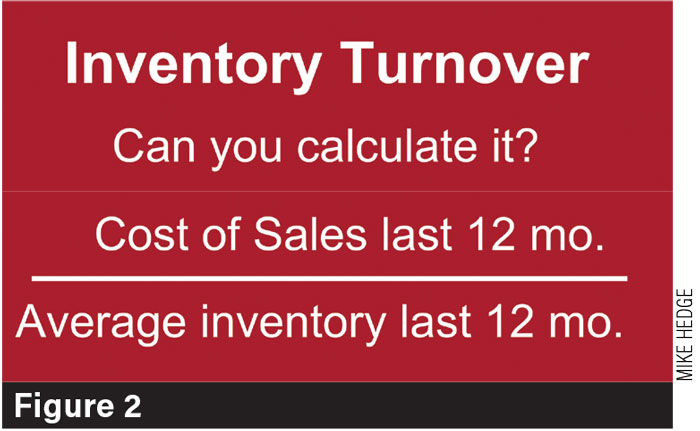
If you’re in a management position, it’s important that you know how inventory turns are calculated so you can know how to affect it. To find your turns, take the cost of sales over 12 months divided by the average inventory over the last 12 months.
Why is it turnover critical? Good turnover really leads to good liquidity. It allows us to turn that to cash without taking a loss. Good liquidity equals good solvency. When we talk about solvency, we’re talking about a dealership’s ability to pay its bills. You’ve got the cash to pay the bills when they come in and provides our dealerships with the opportunity to continue making a profit even in a soft market.
Let’s expand on our used equipment turn example from before and look at the balance sheet and how turnover is calculated.
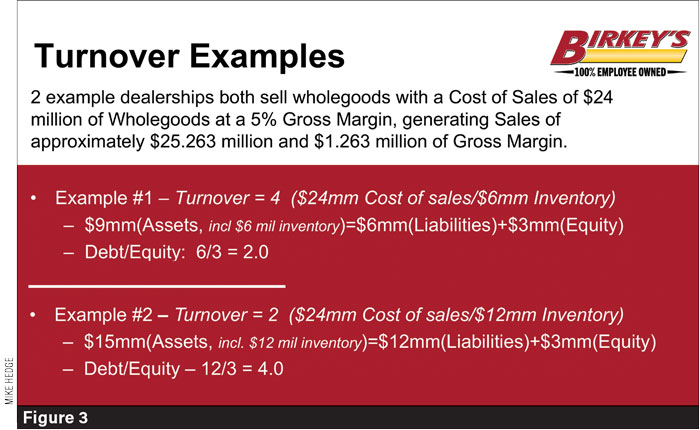
In this particular example, assume that both of them sell wholegoods that have a cost of $24 million with a 5% margin, generating sales of about $25.263 million and $1.263 million of gross margin. In this particular case, your cost of sales is $24 million and we're carrying $6 million in inventory. In this case, the turnover is 4 and we have a very healthy balance sheet with a debt to equity of 2.
In the other example, which maybe is the same dealership but it’s let the inventory stack up, the sales are the same but the dealership is carrying double the inventory. In this case, you have an inventory turn of 2 and a debt to equity of 4.
So what should it be? In a normal market without supply constraints, we should strive to have 4 turns. Will we be there in a down market? It will be a struggle at times to keep it at 4 as the market softens, particularly in the short term. If we can keep it at 4 though, we'll have a good amount of cashflow. We should have a good amount of liquidity and should have cashflow to pay our bills.
Other Key Indicators to Watch & Measure
There are some other key indicators that will tell us things are moving in a different direction when it comes to wholegoods inventory.
Look at your new and used sales mix. Know what the proper mix should be. I can't say what it is for each of your dealerships because they're all different. Birkey’s might be 55% new and 45% used and yours might be 60% new and 40% used. This will be different for everyone. If your sales mix is moving, what else is changing? If we move from 55/45 to 60/40 in conjunction with the turnover that's slowing, that's telling us we've got a potential change in what's going on in the marketplace.
You should also look at your wholegoods to parts and service mix. Maybe typically you're a dealer that sell 70% whole goods, 30% parts and service, or maybe you're 75%, but now that's gone to 80, 82, 83%. Likely, that’s not sustainable in the long run. That movement indicates something is going on that's impacting the business.
Absorption is another critical piece of maintaining solvency in a challenging market. We started working on driving our absorption rate during the last down cycle and I think it behooves us in this market before we get to the next cycle to work on that and try to move that absorption rate up.
Absorption is simply the calculation of our parts gross margin and our service gross margin divided by our total dealership expenses. If that number’s 100%, we can make 0% gross margin in wholegoods and be solvent. We have enough cash to pay the bills.
One way to grow absorption is by increasing technician headcounts. In 2015 we started to really drive absorption. We went on a spree to hire service technicians. It’s tough, but maintaining a full head count in service is an important way to drive absorption.
A technician who generates $200,000 worth of labor revenue will also generate around $160,000 of parts sales to go with that revenue. Of that $360,000, you’ll probably get close to $200,000 in gross margin. So, for every headcount and service you add, you’ll have around $200,000 more gross margin in your business. If you hire 5 or 10 technicians across multiple stores, it can mean a lot of extra revenue in a particularly soft market.
It’s easy to be constrained by thinking you don’t have room to hire another technician. Over the years we’ve found that adding some additional shop space is usually pretty easy to justify. If you can add 2 or 3 techs and keep them reasonably busy, you can pay that back in 3 or 4 years. That’s changing a bit with today’s interest rates, but it’s still worth considering.
However, while there’s a lot of revenue to be had in service, all you’re doing is throwing money away if you don’t have a commitment to grow service revenue. Store managers and service managers have to be committed to growing revenue if you add headcounts.
It’s important to understand that there’s a high opportunity cost for unapplied labor. It’s not only the lost labor opportunity, but the lost parts opportunity as well.
Think about labor as inventory. We pay for 8 hours of a technician’s time in a day. If he bills 6 hours of time in that day and he doesn’t bill the last 2 hours, then that 2 hours is unapplied labor. It’s like buying 10 parts and putting them on the shelf, selling 5 of them and then throwing the 5 you have left in the trash can. That’s essentially what we’re doing with labor when we don't sell that person’s time at the end of the day. The extent that we can drive service productivity allows us to drive absorption and create solvency.
Those of us with multiple locations have a great amount of data. Use it. Benchmark one store against the other. Find out what the best practices are and what the stores that have good performance are doing. Compare their metrics to the others and figure out how to replicate some of the good things from one store to another, then engage your employees in the information. Help them understand. Empower them to make some decisions, and compensate them in a way that is consistent with the outcomes.