As the industry downturn is well into its third year, producers are now taking an even harder look at minimizing the use, and thus the cost, of crop inputs like fertilizers and pesticides, wherever possible without sacrificing crop yields. The quest to reduce inputs without giving up crop productivity presents dealers and manufacturers with opportunities to work closely with their farm customers to improve everyone’s bottom line.
According to a recent Rabobank report (“Farming the Efficient Frontier,” Sterling Liddell, Kenneth Zuckerberg, July 2016), the industry can expect breakeven or lower crop prices for the next 2 years.
“As a result of the combination of lower crop prices and the persistently high cost of inputs, domestic row-crop farming income is likely to be negative again in 2016 and 2017, marking the third and fourth consecutive year of losses.
“In order for the majority of current farm business models to remain viable, production costs will need to decline, with crop prices recovering slightly. The primary drivers of long-term sustainability are lower production — as a result of acreage contraction — and expense reduction, largely as a result of declining cost of land and contraction of other input costs.”
Ag equipment dealers are particularly concerned with increasing costs for consumable materials. Farm input costs have been among the top three of North American dealers’ major concerns over the past 5 years, including number one in 2015 and number 2 in 2016, according to the results of Farm Equipment’s annual Dealers Business Outlook & Trends survey. Studies have shown that when a farmer is confronted with falling commodity prices coupled with rising input costs, more often than not, he will scale back or put off investments in equipment indefinitely as his initial effort to curb overall spending.
While commodity pricing dominates the headlines, Michael Boehlje, distinguished professor of agricultural economics, Purdue University, says at least in the near term, “It’s not about grain prices.”
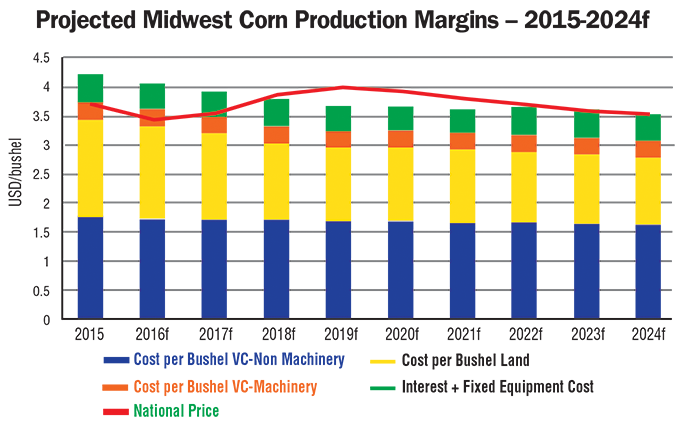
As this chart, which shows representative Midwest farm corn production margins projected through 2024, illustrates, in order for most farms to remain viable, production costs will need to decrease along with crop prices increasing slightly. Source: Rabobank 2016
He says futures and options markets suggest the probability of a price recovery for crops is not very high. “So we need to figure out how to get our profit margins back into positive numbers primarily through cost control. At the same time, we must be really cautious in terms of getting the most productivity out of what we are buying and applying.”
He adds that cost per-bushel per-unit of outputs is what counts. “We have a tendency to talk about costs in crop production on an acre basis, but we don’t sell acres — we sell bushels. So we really want to have our costs denominated in the units of the product that we sell. That’s why we’re really interested in cost per-bushel.”
Of the major crop inputs, Boehlje says, seed purchases may be the most straight forward when it comes to cost cutting. “One of the strategies some farmers have used to cut back on their overall crop production costs is to buy fewer traits of the stacked genes available with corn, soybeans and cotton. That’s not necessarily a bad idea, but what they really need to do is make sure that this doesn’t result in yield reductions. By doing so, their cost per acre goes down, but their cost per bushel goes up because they aren’t getting the yield that they were getting from the traits they were buying previously.”
In fact, according to the results of Farm Journal’s 2016 seed and planting survey conducted in April, 23% of the 688 farmer respondents planned to reduce seed traits in the 2016 season, and 12% said they would switch to more non-GMO seed to reduce input costs.
As for applying other major inputs, Boehlje says the first step should be to determine if an input is actually needed and if it is, what’s the minimum amount that can be applied to achieve desired results. In the case of nitrogen (N), the Purdue ag economist is seeing increasing use of split applications that minimize the loss of N while making it available when the plant really needs it.
With phosphorus (P) and potassium (K) fertilizers, Boehlje says in many cases where they have been used previously, there’s often adequate amount in the soil to allow growers to skip or cut back on their applications. “At least in the short run, growers can reduce their per-bushel costs this way,” he says.
“It’s not rocket science. You either negotiate better prices on what you pay for your fertilizer and chemicals, or you buy lower cost fertilizers and chemicals, while making sure that you get the yield that is being suggested and don’t end up getting reduced yields.”
Boehlje suggests that with the information available to farmers from data collection relative to site-specific production and application technologies, farmers should be able to get at least the same yields with less fertilizer by applying it to the right acres at the right time. Better placement of crop nutrients is the key, which can reduce field losses and leaching, while maintaining high crop yields.
Getting a Handle on Input Costs
Since 2006, the costs associated with crop inputs — fertilizers, pesticides and seed — has represented 48% of crop revenues. This is up from 36% between 1990 and 2006, according to a July 2016 report from the University of Illinois’ Department of Agricultural and Consumer Economics.

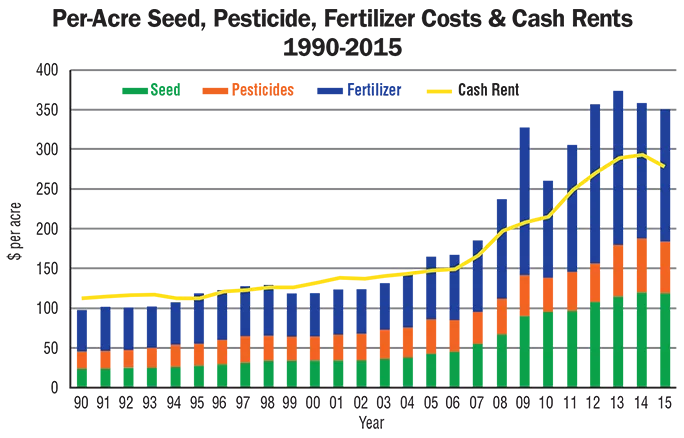
This chart illustrates per-acre fertilizer, pesticide and seed costs from 1990-2015. Two distinct periods can be seen, one before 2006 and the second after 2006. Between 1990 and 2006, costs grew at an average annual rate of 2.6% for fertilizer, 3.5% for pesticide and 4% for seed costs. Growth rates were much higher from 2006 to 2015 when growth rates averaged 8.1% for fertilizer, 5.7% for pesticides and 11.3% for seed. Source: Illinois Farm Business Farm Management

This chart shows the costs on a per-bushel basis. From 1990-2006, costs per bushel were relatively flat as compared to costs on a per-acres basis. Fertilizer costs per bushel increased an average of 1.4%, pesticide costs by 2.4% and seed costs by 2.9%. Since 2006, the increases have been much larger. Fertilizer costs per bushel increased an average of 5%, pesticide costs by 4.6% and seed costs by 10.1%. As a result, costs per bushel have grown in recent years. Source: Illinois Farm Business Farm Management

A third perspective on crop input costs is depicted here as costs as a percent of revenue. Growth rates are lower when stated as a percent of crop revenue compared to the previous measures. Before 2006, fertilizer costs grew an average of 0.1%, pesticide costs by 1.1% and seed averaged 1.5%. Again growth rates are higher after 2006. Between 2006 and 2015, fertilizer costs grew an average of 4.1%, pesticide costs by 1.8% and seed costs by 7.2%. Source: Illinois Farm Business Farm Management
The authors contend in lieu of higher grain prices (e.g., $4/bushel corn) farmers will find it difficult, if not impossible, to be profitable without reducing input costs. The report entitled, “Growth Rates of Fertilizer, Pesticide and Seed Costs Over Time,” was authored by ag economist Gary Schnitkey and Sarah Sellars.
The authors say, “Farmers need to take proactive actions to reduce rates and amounts of inputs applied. Even with aggressive input usage cuts, it will be difficult for cashflow losses to be reduced without input price decreases.”
In their work, input costs were calculated in three ways:
- Costs per acre
- Costs per bushel (cost per acre divided by yield)
- Cost as a percent of crop revenue (cost per acre divided by yield times corn price)
Regardless of the measure used to calculate input costs, the research shows that fertilizer, pesticide and seed costs have grown on a per-acre and per-bushel basis, as well as a percent of crop revenue.
Using input prices compiled by the Illinois Farm Business Management program for high productivity farms in central Illinois, the study shows between 1990 and 2006, costs grew at an average annual rate of 2.6% for fertilizer, 3.5% for pesticide and 4% for seed. Growth rates were much higher from 2006 to 2015. During this timeframe, growth rates averaged 8.1% for fertilizer, 5.7% for pesticides and 11.3% for seed.
Overall, between 1990 and 2015, fertilizer costs per acre have ranged from a low of $51 in 1993 to a high of $200 per acre in 2012 (+74.5%). During the 25 year span covered by the data, fertilizer costs are up by 68%.
Pesticide costs during this period have ranged from a low of $22 per acre in 1990 to $67 per acre in 2014 (+68.2%). The biggest hike in the cost of pesticides came between 2012 and 2013 when they rose to $66 per acre from $49, or by about 35%.
Input Costs vs. Cash Rents
While high cash rents are often singled out as a major stumbling block to farmer profitability in the current economy, in another University of Illinois research report, Schnitkey demonstrated that costs for consumable inputs have far outstripped those of land rents in recent years.
“Pre-2005, cash rents typically were higher than the three crop costs [fertilizer, pesticides and seed],” says Schnitkey in the July 27 report entitled “Growth in Crop Costs and Cash Rents.” He goes on to say, “Since 2006, the three crop costs grew more than cash rents, resulting in the three crop costs being consistently higher than average cash rents.
“In 2015, these three crop costs plus cash rent represented 72% of total costs on cash-rented farmland. Since these costs represent such a large portion of total costs, significant cuts will only occur if these crop costs and cash rent are reduced.”
The ag economist points out that expenses decreased between 2014 and 2015. “Seed costs decreased by $2 per acre, pesticide costs by $1 per acre and fertilizer costs by $5 per acre. Taken together, the three crop costs decreased by $8 per acre. Cash rents decreased by $15 per acre. In total, the three crop costs plus cash rents decreased by $25 per acre.”

The stacked bars here illustrate three crop costs — seed, pesticide and fertilizer — stated on a per acre basis and represent averages for corn grown on high-productivity farms in central Illinois. During the timeframe of 1990-2015, total costs was lowest in 1990 at $98 per acre. The highest level of these costs came in 2014 at $358 per acre. In 2015, these crop costs decreased by $8 per acre to $350 per acre. It also shows the average cash rents for this period. The lowest average cash rents occurred in 1990 at $112 per acre, and the highest level were in 2014 at $293 per acre. From this high, cash rents decreased $16 per acre to $278 per acre in 2015. Source: Illinois Farm Business Farm Management
Schnitkey expects a larger decrease between 2015 and 2016. “Illinois Crop Budgets suggest a $41 per acre decrease in fertilizer costs. Seed costs are anticipated down by $2 per acre. Cash rents are projected to decrease $10 per acre. If projections hold, the three costs plus cash rent would decrease by $53 per acre.
Even given this decrease, net returns to the farmer are projected to be negative on cash-rented farmland, he says, and adds, “At this point, higher prices in 2017 do not seem likely, with corn price expected to be below $4 per bushel.”
According to Schnitkey, up to this point, most cost cuts have come from cash rents and fertilizer, with minimal reductions from seed and pesticides. This may signal a realignment away from historical shares of costs that existed from 1990 to 2006.
If this occurs, seed and pesticides will represent a higher share of total costs and crop revenue than historically has happened.”
The Rabobank report suggests that during the next few years, non-machinery variable costs will decline, “which will most likely be created by both efficiency gains in application and price reductions in fertilizer and crop protection.”
Special Report Table of Contents
Can Application Technologies Reduce Ag Input Costs?
Three years of low grain prices are forcing farmers to minimize production costs. Developments in how they apply inputs will be an important part of growers’ cost cutting.
Making a Case for Curbing Spending on Inputs
Few signs point to a recovery in crop prices in the near term, which is making it imperative growers find ways to hold down costs.
What’s Trending in Ag Application Technology?
Developments in applying crop nutrients and pesticides have come fast and furious during the last decade. Many of the newest breakthroughs are aimed at ‘site-specific’ management of inputs, nozzles and individual nozzle control, and soil applications.