The results from an annual survey of U.S. no-till farmers reveals that despite a downturn in grain prices and some challenging springtime weather, 2013 produced the highest crop yields in several years. Even with the big yields, no-till farmers scaled back their machinery purchases.
The data reported in the 6th annual “No-Till Operational Benchmark Study” is the result of 418 readers of No-Till Farmer’s Conservation Tillage Guide, a sister publication of Ag Equipment Intelligence.
Nearly 60% of readers saw a gain in net income over 2012. However, it is interesting to note that the decliners endured larger drops in net incomes than those who experienced gains. Overall, the average gain per farm over 2012 was 2.5%. That compares to a 16% gain in net income in the drought year of 2012 vs. 2011.
Operating Expenses
Of the farmers surveyed, on average they farmed 1,466 cropping acres — the largest in the survey’s 6 years and far exceeding last year’s average acreage of 1,215.
A primary reason for the increase is that the double-cropped acres are now being more accurately recorded to reflect the growth of crops on an acre in a year.
Overall, No-Till Farmer readers spent, on average, $509,708 on inputs for their entire farm. That was $30,100, or 6.3% more than in 2012, and $36,467, or 7.7% more than in 2011.
Considering the increase in the overall average cropping acreage, the average costs of inputs per acre saw a substantial decline to $347.69, which was 13.5% less than average expenditures of $394.74 per acre in 2012.
Following is the percentage change in some of the bigger-ticket itemized per-farm costs from 2012 to 2013:
• Fuel — A 20% increase overall per farm, but a 0.5% decrease on a per-acre basis
• Land Rent — An 11% increase overall per farm, but an 8% decrease on a per-acre basis
• Seed/Seed Treatments — A 14.5% increase overall per farm, but a 5% decrease on a per-acre basis
• Pesticides — A 30% increase overall per farm, but a 7% increase on a per-acre basis
• Fertilizer — A 0.4% decrease overall per farm, and a 17% decrease on a per-acre basis
• Equipment — A 24% increase overall per farm, and a 3% increase on a per-acre basis
• Labor — A 1.1% increase overall per farm, but a decrease of 16% on a per-acre basis
Equipment Buys Slowdown
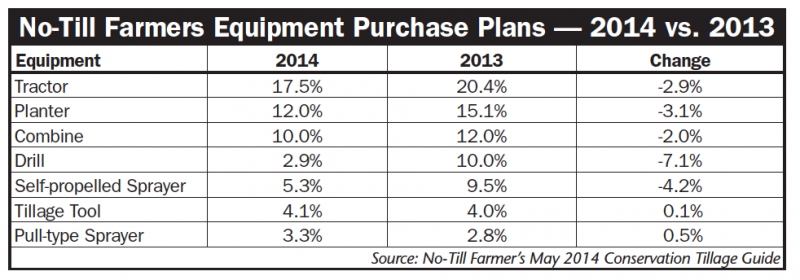
For the first time in several years, planned equipment purchases by no-tillers heading into the 2014 production season saw a decline across nearly all machinery segments.
Whether caused by declining commodity prices, or the fact no-tillers have been upgrading equipment regularly during the recent ag boom, the readers of No-Till Farmer’s Conservation Tillage Guide applied the brakes on their purchases.
Following are the segments that saw purchase declines: tractors from 20% to 17.5%; planters from 15% to 12%; combines 14% to 10%; self-propelled sprayers from 10% to 5%; and drills/air seeders from 10% to 5.5%.
One note of interest: Last February, the average no-tiller estimated he would spend $59,337 on equipment purchases throughout 2013. But they ended up spending on average $87,921 for machinery per farm.
That continues a trend during the 6 years of the benchmark study of no-tillers purchasing more equipment than what they estimated — meaning farmers will likely take a wait-and-see approach to whether they will purchase equipment based on year-end financial performance.
Top Growers
For the purposes of the no-till survey, the top one-third of growers were broken out and examined to determine how their practices differed from all respondents.
Top growers were classified as those with the highest yields for soybeans and corn. For soybeans, on average the top one-third of growers achieved yields of 59.9 bushels per acre, down slightly from the 60.5 bushels per acre recorded in 2012.
Despite smaller-than-average cropping acres, the top-yielding no-till soybean growers spent more on their operations than the average no-tiller, overall. At $535,843, they out-spent the average no-tiller by $26,135, or by 5%. At $417.32 per acre, top soybean growers outspent the top corn growers by $10.21 per ace, or 2.5%, and the average farmer by $69.63, or 20%.
For corn growers, the top-third for corn yields averaged 197 bushels per acre, which was an increase of 24 bushels to the acre, which was higher than the top one-third no-till corn growers in 2012. With the average no-tiller hitting 161 bushels to the acre, the top one-third of corn growers had a 22% yield advantage over the average no-tiller.
The top-yielding corn growers use more technology than the average no-tiller. While 33% of all No-Till Farmer readers use variable-rate fertility, 41% of the top corn yielders use the technology. Variable-rate seeding is used by 30% of high-yielders to 22% on average. GPS tractor auto-steer sees a 56%-to 49% advantage for the high yielders. The same can be said for yield mapping (54% to 43%) and yield-monitor data analysis (51% to 45%).


