Forecast vs. Actual
Our database for tractor retail sales and field inventory is derived from AEM’s monthly Flash Reports.
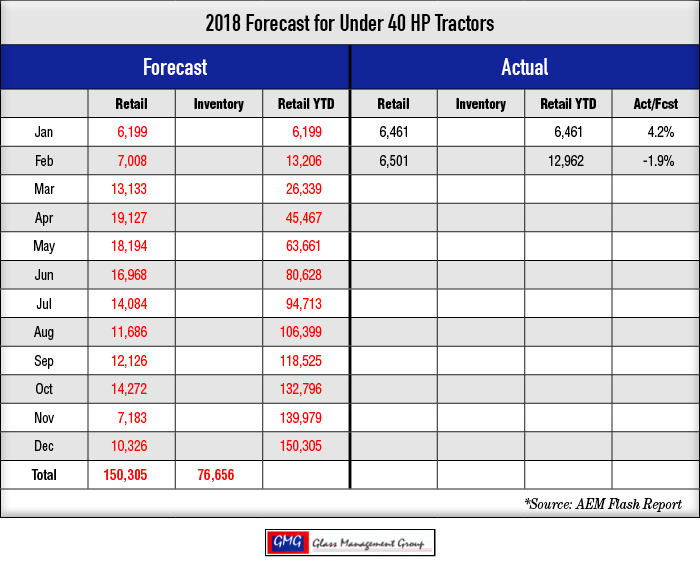
Under 40 Horsepower Tractors — Retail sale activities for this small tractor category remained good but finished slightly below our monthly forecast while the year-to-date total came in at slightly below our forecasted amounts.
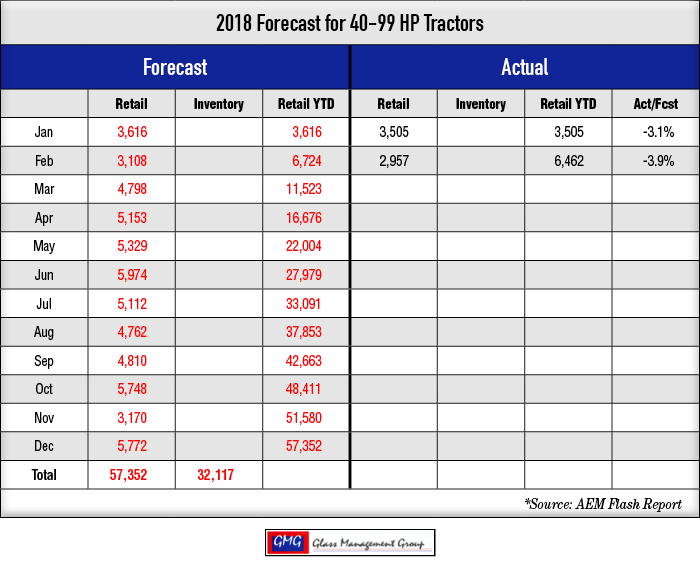
40 to 99 Horsepower Tractors — Retail activity for this category for the month was slightly below our forecast and the year-to-date total was –3.9% of the forecasted amount.
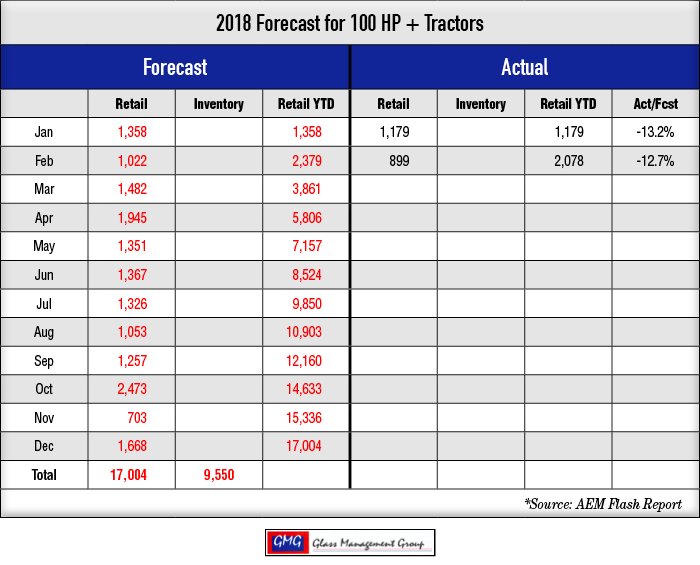
100+ Horsepower Tractors — This segment continued to show weakness and the monthly sales result was well under our monthly forecast and the year-to-date totals moved closer to our forecast but finished –12.7% below.
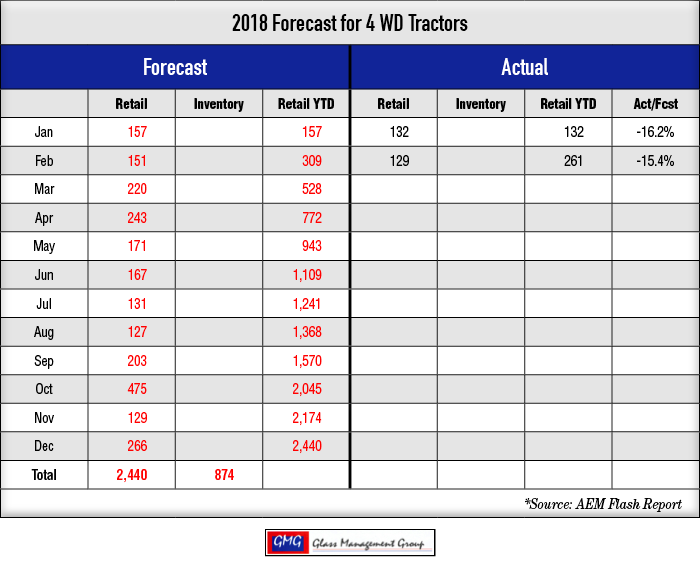
4 WD Tractors — These larger tractors continue to show weakness as the monthly retail activity was under our monthly forecast and the year-to-date results were –15.4% of forecast.
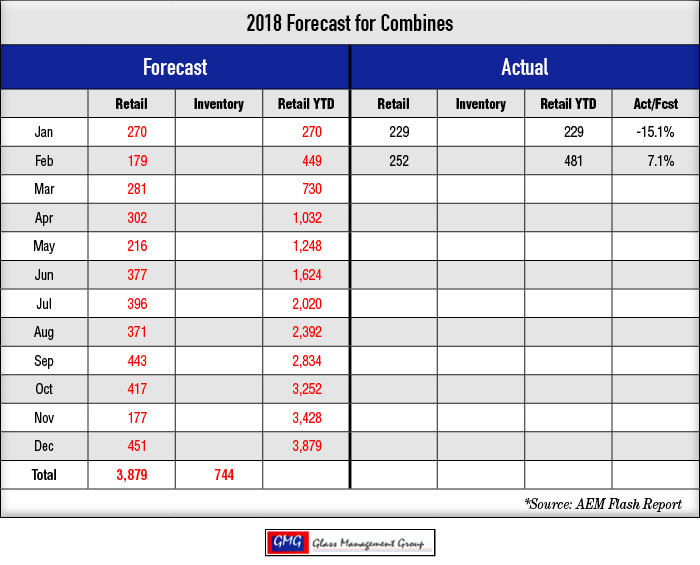
Combines — Combines have shown some strength for the past 2 months and exceeded our year-to-date forecast by 7.1%.
Profitability Equals Purchases
In order to construct our annual forecast, we must establish a series of assumptions and one of the foundational assumptions is that there is one buyer/decision maker per farm. In smaller farming operations that is often the principal operator, but with larger acreage farms it could be a group of people who ultimately make the decision to purchase new equipment. No matter who made the decision, the final decision is often made after a close review of the farm’s P&L.
Our U.S. farm financial database includes USDA data and other published data by various land grant colleges across the country. Farm productivity certainly varies with the crop varieties produced on the farm and row-crop producer’s net income differs from that of livestock producers on per/acre basis, so it is difficult to develop an “average farm profitability” number. A high altitude view of the data produced some interesting results:
- Approximately 40% of U.S. farmers were profitable in 2016 and likely the same number in 2017.
- Approximately 30% of U.S. farmers averaged a breakeven level in 2016.
- Approximately 30% of U.S. farmers produced a negative income in 2016.
How Does This Affect Equipment Sales in 2018?
The more profitable farmers tended to be the larger acreage producers who generated an income that was significantly higher than the living expenses for the principal operator and family. These farmers added to their net worth even in a down year such as 2016 and 2017 and maintained a solid relationship with their principal lenders. These farmers were also more likely to be aggressive marketers of their crops and utilized futures contracts as a means of increasing their total income. Even though they have the capacity to purchase new equipment they are actively seeking ways to continue to reduce their overhead expenses in these lean years and will most likely only purchase tractors and combines that require replacement this coming year.
The group of farmers who “averaged” a breakeven position certainly included some producers who generated a small profit in 2016 and 2017. These farmers were generally those of the mid-sized operations whose total gross income was lower than the largest operators. Even though they may have produced an equal percent of profit as the larger farmers, their reduced income resulted in a smaller net profit. This group also included some farmers who genuinely broke even in their farming operations while seeing a slight decline in their financial status. Obviously, the remaining famers generated a production loss in their operations during these difficult years. The probability that this group will purchase tractors and combines above those that necessarily require replacement is very doubtful.
Many farmers in the breakeven group and in the non-profitable group have an off-the-farm income to supplement their farm income. Having a strong, personal relationship with their lender will often determine if they will continue in their farming operations. Consolidation among farmers has been taking place for several decades and some of these farmers are candidates for retiring or simply exiting farming, contributing to the ongoing consolidation trends.
Commodity Prices
The University of Minnesota’s Center for Farm Financial Management reported that farmer/members in their state averaged 208 bushels per acre for corn production and the breakeven point for commodity prices for the national average of 175 bushel/acre was $4.07 per bushel.
Corn — The March corn contract closed the month at $3.76 per bushel and the May contract closed at $3.82 per bushel while the July contract closed at $3.89 per bushel. These prices were about 4% above the January close but remained below most farmer’s breakeven point.
Soybeans — The May contract closed at $10.45 and that was about 5% higher than the January close. The May soybean contract closed at $10.55 and the July contract closed at $10.64 per bushel with both showing about a 5% gain over the January closing prices.
Conclusion
The strength of the U.S. economy continues to provide support for the smaller tractor sales but the recent declines in the stock markets will have a sobering effect upon some future purchases. The Under 40 horsepower class and the lower third horsepower range of the 40-100 horsepower class will remain strong in spite of the gyrations on Wall Street. Increasing wages, along with recent bonuses to employees and reduced taxes will continue to fuel this segment of the market and these smaller units will remain the real movers in the market.
It is certainly early in the year, but we have seen nothing in the recent activities that would indicate that our original forecast is not still valid.


