Our databases include information for tractor sales derived from AEM’s monthly Flash Reports that dates back to 1969, USDA reported net farm income that dates back to 1969 and U.S. Department of Labor’s GDP data that dates from 1970. We also house information from USDA Agricultural Censuses from 1978 to 2012. All of this data is essential in making a reasonable forecast for the industry.
Our models track commodity prices, international currency exchange rates, total number of farms, total number of farms by gross production value and we produce an estimate of the number of farms that are actually purchasing tractors and combines each year. In reality, this means that every element within our forecasting models must perform just as predicted in order for our annual forecasts to be accurate. The probability of being 100% accurate is extremely remote. Our accuracy goal for these forecasts is to be within +/– 5% of the annual totals. Here is our 2018 U.S. forecast and the rationale of how we arrived at those numbers.
Under 40 Horsepower Tractors
For the past decade, this category of tractors has generated more than 50% of the total tractors and combines sold in the U.S. Sales in this segment have continued to climb in light of the weak sales for the larger horsepower tractor in recent years. We expect this category to produce approximately 65% of the total number of tractors and combines sold in 2018.
The purchasers of these tractors, for the most part, are not “production” farmers and derive their income from sources other than farming operations. Consequently, the drivers for this segment are found in the general economic conditions of the country. Currently, these conditions are very positive with unemployment falling to new low levels and businesses across the country beginning to see increases in sales and net incomes. This has resulted in increased salaries for the first time in nearly a decade and a rising stock market has provided significant growth to IRAs and 401Ks from both market action and increased contributions due to increased salaries.
These purchasers tend to trade their tractors more often than do farmers and ranchers who purchase the larger horsepower units and tend to view their tractors much the same way that they view their automobiles. Typically, these tractors are used less than a tractor utilized in production farming operations and our estimate of hourly usage is approximately 75 hours per year.

40 –100 Horsepower Tractors
This category of tractors must be viewed as a transitional category. The lower one-third of the horsepower range (40–60 HP) is principally purchased by the same buyers as found in the under 40 horsepower category and their purchases are driven by the same factors as that of the smaller horsepower category. Like the lower horsepower tractors, the demand for these tractors has been growing for the past several years and that growth will continue into 2018.
The higher horsepower ranges of this category are driven by the agricultural economic conditions that exist today and those conditions have been depressed for several years now. There is a slight indication that some growth is returning to the agricultural economy with net farm income expected to rise by approximately 3% over the 2016 level, but that is probably not enough to foster a rapid increase in sales for this category.
Corn prices continue to hover around the break-even point for most farmers and that will have a dampening effect upon some equipment purchases in 2018. Soybean farmers will see some profitability in their operations, but probably not enough to produce a significant increase in tractor purchases.
The general long term trend for this category is positive, but that is driven by the strength of the smaller horsepower tractors generating slightly less sales than losses in the larger horsepower sizes sales numbers.

100+ Horsepower — 2 WD Tractors
This category of tractors is fully at the mercy of the U.S. agricultural economy and it has not fared well for the past several years. The long term trend for this category is decidedly down and, when forecasting, the trend is your friend. This class of tractors populates many of the farms across the country and increased sales here is totally dependent upon profitable farming operations. Lower commodity prices, increasing input costs along with a tightening credit market certainly produces downward pressure on these costly units. Our models are suggesting a continued decline in retail sales for 2018 but at a slower rate of decline than seen in 2017.

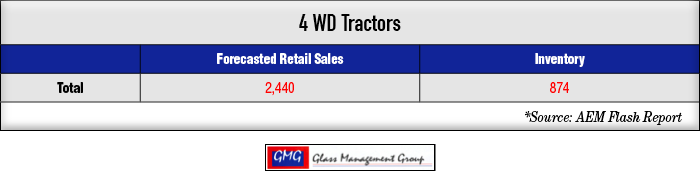
4WD Tractors
The financial impact driving these tractors is similar to those driving the 100+ horsepower equipment, but there is a much smaller set of buyers for this category. Those buyers are the largest farmers, and often the most profitable farmers, in the country. Like the other categories, there are a base number of units to be replaced each year and that has a stabilizing effect upon the total units sold annually in this low volume category.
The long term trend for 4WD tractors has shown a bottoming pattern begin to develop and while that is not an indication of substantial increases in sales numbers, it is an indication of stabilization in this category. Our models are suggesting a very slight improvement over 2017 and that could be a harbinger of better days ahead in the next several years.
Combines
Combines are more directly affected by the rise and fall of commodity prices than are any of the tractors sold today. Corn and soybean prices reached their zenith during 2013 and 2014 and propelled combine sales to more than 10,000 units annually. As prices have fallen, so have combine sales. The long term trends indicate that weaker sales lie ahead but there are signs that there is a bottom building for them. Our models continue to suggest that 2018 will be a year that will produce a lower sales volume and our forecast follows those indications.

As we have done in the past, these total numbers will be our forecast for 2018 and we will spread the monthly forecasts after the release by AEM of the December Flash Reports in early January, 2018.


