Here is Glass Management Group’s discussion and analysis of the farm equipment sales report issued by the Assn. of Equipment Manufacturers on April 10, 2017.
Forecast vs. Actual
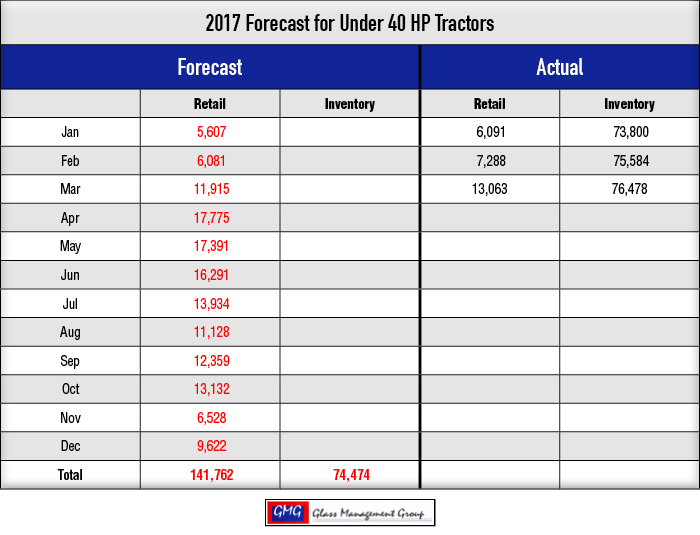
Under 40 Horsepower Tractors — A strong general economy has provided momentum for this segment of tractors as March recorded solid growth with 13,063 units. The year-to-date totals are slowly closing in on our original forecast and currently stand 12% above our year-to-date forecast for March.
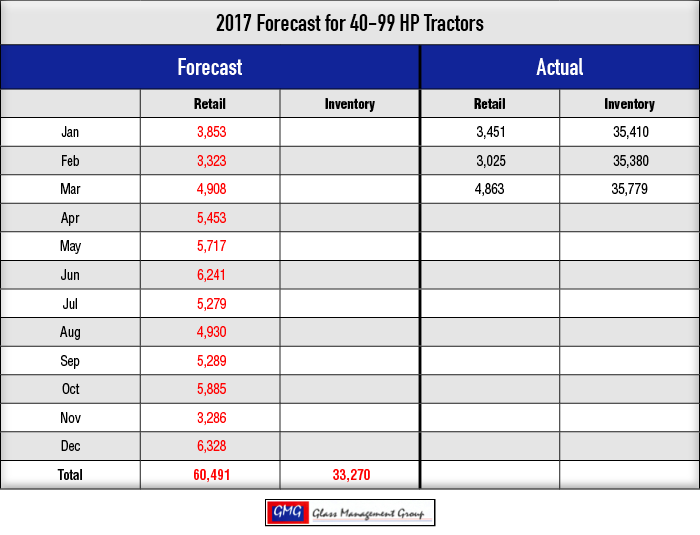
40 – 99 Horsepower Tractors — This segment of tractors also recorded a solid month of retail activity with 4,863 units retailed. The year-to-date total of 11,339 units is nearing our original forecasted number of 12,084 units YTD leaving us 6.6% above the actual results.
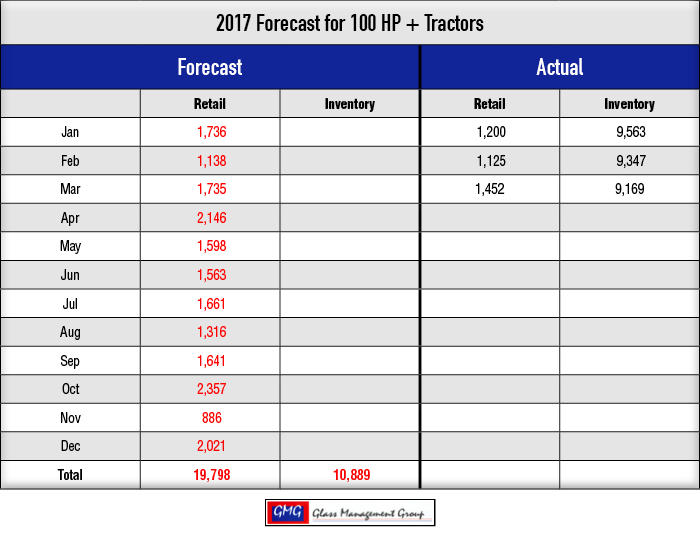
100 + Horsepower Tractors — The weakness of the agricultural economy is shown in the results of this category with 3,777 units retailed year-to-date against our original forecast of 4,609 YTD. However, the gap is slowly closing each month.
4 WD Tractors — Reduced cashflow on the farm can certainly be seen in these results with 229 units retailed in March. The year-to-date total for this category reached 457 units and is inching closer to our forecasted number of 595 YTD.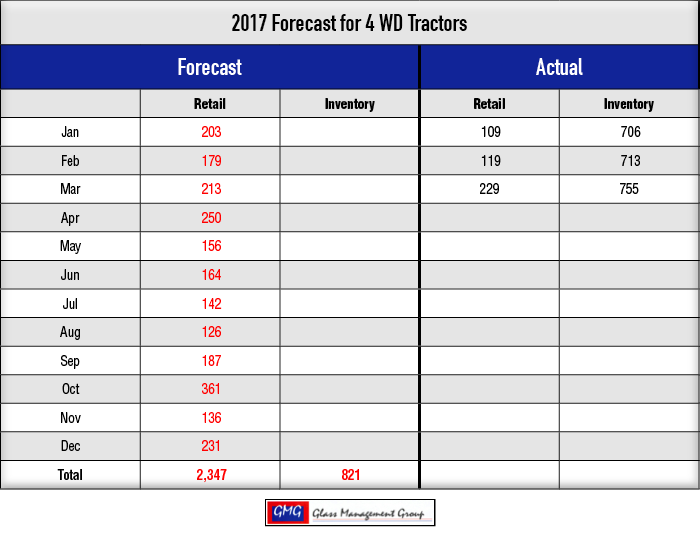
Combines — March 2017 saw an increase in retail sales over the same month last year with 300 units retailed. The year-to-date total for combine sales stands at 715 units compared to our original forecast of 853 YTD. 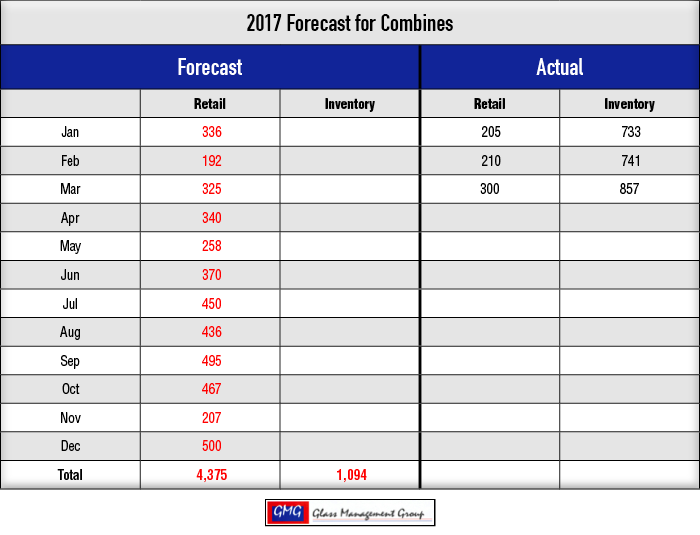
How Does the US Ag Economy Relate to the U.S. General Economy?
The U.S. non-farm economy began a significant upturn in December 2016 and has not looked back. The Department of Labor just reported that job growth in March resulted in 98,000 new jobs, which was about half the expected amount, and that unemployment was now at a record low 4.5%. The Bureau of Labor Statistics reported that total employment in March rose by 472,000 while those unemployed fell by 326,000. New manufacturing orders continue to increase each month, along with shipments and order backlogs. There is an air of confidence wafting across the nation as the realization that our nation’s economy is picking up steam rapidly.
During a recent conversation with one of our investment firm clients, the question arose about how the U.S. agricultural economy related to the general economy. Although I thought I knew the answer, I asked for and was granted some time to do research on the subject.
In terms of net farm income, the U.S. ag economy reached its pinnacle in 2013 when farmers generated $123.8 billion in net farm income. That was nearly 10 times the income produced in 1970 ($14.4 billion), the beginning of another banner period for ag equipment sales. Net farm income in 1972 was $19.5 billion and saw a meteoric rise of nearly 80% in 1973 when net farm income rose to $34.4 billion. During this same period, GDP growth reached its zenith in 1972 at 6.9% but in 1973 fell to 4% growth and turned negative in 1974.
Historically, the non-farm economy as defined by GDP growth has preceded the ag economy by about 12-18 months. As we prepared our annual forecast last November, our net farm income models indicated that 2017 and 2018 would be relatively flat and growth would reappear in 2019 for U.S. farmers. Our data established long ago the principle that the previous year’s net farm income levels would determine the next year’s equipment sales volume and that has been proven time and again over the past four decades.
There are many factors that come into play in new equipment sales and the level of used inventory is an important one to consider. My good friend, Jim Irwin, pointed out to me that while the value of used combines at dealerships declined, the actual number of used combines is relatively unchanged from this time last year. It simply means that dealers have sold higher priced used equipment and taken lower cost ones in on trade but they still have the same number of units on their lots.
In a report recently released on Agweb.com, 500 farmers identified the ways in which they were reducing cost from their operations and the top of the list was “reducing farm equipment purchases.” The next was “delay non-equipment capital purchases.” 2016’s net farm income was about half that of the 2013 level and that has resulted in some severe belt-tightening across farm country. The principal different between the current retraction and that which occurred in the 1970s is the level of debt the average farmer had incurred. There certainly are some farmers today who have high debt but, for the most part, the average debt is considerably below that of the 1970s.
The U.S. gross domestic product total reached $16.8 trillion dollars in 2016 and the agricultural economy contributed about 1% of that total value but still remains a vital industry for our nation. The production of food and fiber for those producing the other 99% of GDP is essential for their livelihood and success.
So, where are we now? We are still in a “trough” on the sine wave of equipment sales and will probably remain there for the next year or so, but there is light at the end of the tunnel.
Commodity Prices
Commodity prices during March took a bit of a hit as they all settled lower than the February close. The U.S. Department of Agriculture released its first planting intention report for 2017 and it indicated that corn acreage would decrease 7% resulting in about 90 million acres planted while soybean acreage would increase by 8% with slightly less than 90 million acres planted in 2017. These numbers are certainly subject to change as the planting season progresses.
The USDA planting intention report also indicated that cotton acreage was expected to increase by 21% with 12.2 million acres in production.
Corn: The May contract closed on March 31 at $3.64 per bushel and that remains at or below the cost of producing a bushel of grain. The July contract closed at $3.71 per bushel with both contracts approximately 9 cents per bushel below the February close.
Soybeans: The May contract closed at $9.46 per bushel and that is $0.89 per bushel below February’s close. The July contract closed at $9.57 per bushel, which is $0.88 per bushel below the February close.
Conclusion
There is no doubt that 2017 is going to be a difficult year for the ag equipment markets, but there is a continuing persistence to look beyond the present gloom and toward the promise that the future holds. Our view of 2017 is that it is most likely a year that will record the bottom for the current decline in equipment sales and that 2018 will offer a limited opportunity for improvement.
There is some glimmer of hope in many of the retail numbers recorded in March and with any improvement in commodity prices we could close the year in a much stronger position than we now envision. Is this just a “blue sky” hope of an end to our present unpleasantness? I really do not think that it is, but can see that 2017 will see a slight improvement over last year’s results.


