The results of the North American Equipment Dealers Assn. (NAEDA) 2025 Cost of Doing Business Study reveal that while the year-end results for 2024 were not what anyone wanted to see, they were by and large what was expected.
“Some of the negatives were dramatic, and the net income before tax was reduced; however, perhaps this is a return to reality for the conditions we faced this previous year,” notes Curt Kleoppel, CFO of NAEDA and president of Equipment Dealer Consulting. “We must remember that in 2023, actual year-end results were still strong, and in 2024, we continued to have higher interest rates and more inventory that could not be sold at the same margins.
“Looking forward, it will depend on new inventory/parts levels, interest rate levels and used equipment levels. So far, we have not seen a drastic increase in used equipment, and the interest rates have gone down a little.”
It’s important to note that in this discussion and in the tables and charts below, the year listed is the year of the study. For instance, 2025 covers the results dealers reported for 2024, 2024 covers the results of the 2023 business year and so on. The report gathers data and analyzes it in 3 categories: sales less than $50 million, sales of $200-$600 million and sales over $600 million. For the purpose of this article, we will only be looking at the two larger sales categories, and unless otherwise noted the numbers are from the U.S. report. NAEDA also assembles a report for Canada and OPE dealers. Coverage of the OPE report will be available on Rural Lifestyle Dealer.
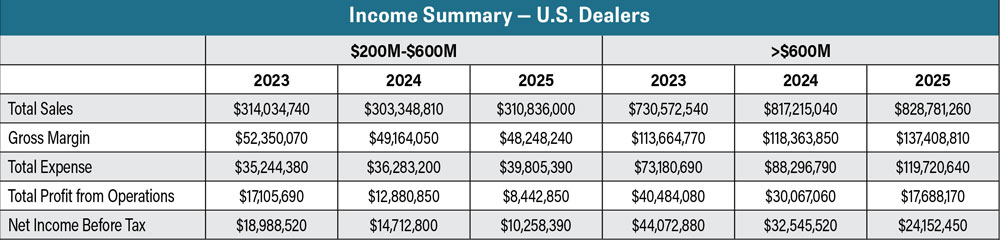
While total sales increased in the 2025 report for both categories, total expenses were up as well. Source: NAEDA Cost of Doing Business Studies
Balance Sheet Review
A review of the balance sheet shows there have been some significant changes in several major areas, says Kleoppel. Cash was down in all sales categories, with cash on hand decreasing $4.6 million from $27.6 million in the 2024 study to $22.2 million in 2025 for dealers in the over $600 million category. While down year-over-year, cash on hand for this category was still above the $16.8 million noted in the 2023 CODB study. In the $200-$600 million group, cash on hand declined by $585,510 to $5.53 million in the 2025 study. Compared to the 2023 report, cash is down $3.5 million.
Inventory levels increased slightly from a year ago due to the continued increase in new inventory availability and decreased in the higher volume dealer category, Kleoppel notes.
Key Observations
- >$600M volume dealers increased 2.1% in margin, $200-$600M volume dealers decreased .69% in margin.
- Inventory turns were 2.52 times for $200-$600M volume dealers, and 2.82 times for >$600M volume dealers.
- Parts aftermarket absorption was 38.45% for $200- $600M volume dealers, and 26.68% for >$600M volume dealers.
- The >$600M volume dealers’ total inventory in dollars decreased close to $9.6 million. This represents a substantial change from a year ago.
- Total sales volume increased by $7.48 million for the $200M-$600M volume dealers, and increased by $11.5 million for >$600M volume dealers.
- For the $200-$600M volume dealers, new equipment increased by over $3.68 million, and used equipment increased by over $2.58 million.
- For service gross margin percentages, $200M to $600M volume dealers were 67.38%, and $600M volume dealers were 52.18%.
- Parts and Accessories gross margin percentage was 30.06% for the $200-$600M volume dealers and for >$600M volume dealers it was 26.98%.
New inventory for dealers in the $200-$600 million range was 40.75% as a percentage of total assets and decreased for the dealers in the over $600 million group to 31.17%.
“The good news is that the used inventory percentage ranged from 9.95% to a high of 25.97% for the three categories, which, compared to a year ago, only showed a slight increase in the first two categories and a significant decrease in the higher volume category,” Kleoppel explains.
Both groups saw an increase in current liabilities, with most of the increase coming from floorplan payables and accounts payables, which Kleoppel says coincides with the overall increase in total inventory.
Income Review
Total sales volume increased in all categories, with the $200-$600 million volume dealer group increasing by $7.48 million and the over $600 million category going up by $11.5 million. Kleoppel points that the increase in sales volume helps create the potential to increase net income and equity. In actuality, it did not increase net income in any of the categories, he says. The over $600 million group saw an increase in gross margin, and both groups saw total expenses increase.
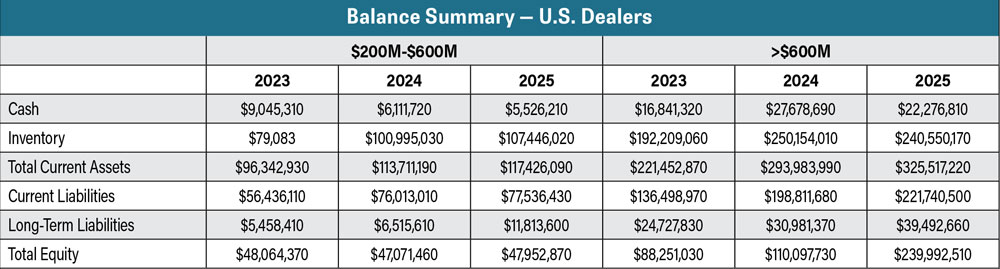
The 2025 report shows chase was down in all revenue categories, down $4.6 million in the >$600M group vs. 2024. Source: NAEDA Cost of Doing Business Studies
Equity, however, did increase for both categories due to the addition of net income, he says.
Kleoppel says dealers once again did a decent job of controlling their overall operating expenses. That said, he points out that a few areas increased dramatically, causing less earnings potential.
Some of the bigger increases for both revenue groups were in total salaries and benefits, interest expense, lost warranty and bad debts, Kleoppel notes. Salary increases come naturally with an increase in sales volume due to commissions being paid out, he says, and “the constant increase in health insurance costs” explains the increase in benefit expenses.
Salary and benefit expenses increased by $1 million for the $200-$600 million category and by $17.4 million for dealers over $600 million.
The combination of high inventory levels and a rise in interest rates contributed to the increase in dealers’ interest expenses. Interest expenses were up $750,000 for the $200-$600 million category and by $3.8 million for dealers in the over $600 million in volume category.
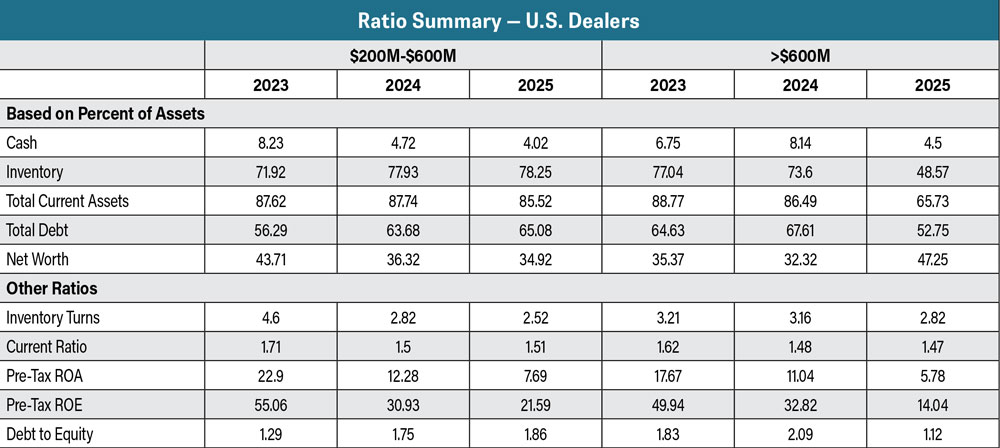
Despite the increase in sales volume, inventory turns were down once again in the 2025 report. Source: NAEDA Cost of Doing Business Studies
“Continuing into the following year, we expect to see the same increase in interest expense, due to the continued high rates and inventory levels,” he says.
Both groups saw an increase in lost warranty expense, up $190,000 for the $200-$600 million group and up $1.24 million for the over $600 million group. “These are some significant increases,” Kleoppel says. “Bad debts did not help the bottom line for the larger two categories, which increased by $54,000 for the $200-$600 million dealer. But the larger volume dealer increased by $1.55 million, which is probably due to the producers not being able to make payments.”
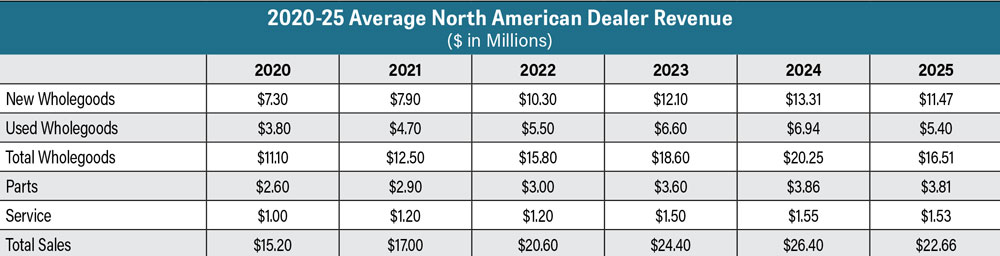
Average revenue for North American dealers was down in all segments year-over-year in the 2025 report. Source: NAEDA Cost of Doing Business Studies
Net income decreased for both categories and net income as a percentage of sales was down as well, with a decrease of 1.55% for the $200-$600 million group and by 1.07% for the largest dealers. Kleoppel explains that this decrease for both groups is the result of total operating expenses as a percentage of sales increasing as noted above.
Ratio Review
Inventory turns were down for both groups despite sales volume increasing. “The decrease in inventory levels was not enough to increase inventory turnover since sales didn’t increase dramatically,” Kleoppel says. “It could also be attributed to the drop in inventory for the higher volume dealer and the offsetting decrease in overall debt.”
He notes the over $600 million group saw the largest decrease in turnover, which was 0.34 lower than the previous year.
The total debt to equity ratio decreased for the higher volume categories, which Kleoppel says is a positive signal. It improved by 0.97. The debt to equity ratio increased by 0.11 for the dealers in the $200-$600 million grouping.
About the Cost of Doing Business Study
The annual Cost of Doing Business (CODB) Study is made possible through the cooperation of the participating dealer associations and their equipment dealers who provide detailed financial and operational information for their individual companies.
Questionnaires were mailed to all dealers in the participating association territories to collect detailed financial and operational information for 2024.
All completed questionnaires and financial reports were returned to Equipment Dealer Consulting, LLC, with the data being compiled by Curt Kleoppel, CPA, CVA and his accounting team. All individual company responses are treated as strictly confidential.
For more information contact Curt Kleoppel at curt@naeda.com.
Finally, looking at return on equity (ROE), the $200-$600 million volume dealer decreased from 30.93% to 21.59%, and the over $600 million volume dealer decreased from 32.82% to 14.04%.
Each of these dealers had less net income compared to the net income reported by these dealers in previous years, and their total equity increased, resulting in a lower ROE percentage. The return on assets (ROA) shows similar changes. The $200-$600 million volume decreased from 12.28% to 7.69%, and the >$600 million volume decreased from 11.047% to 5.78%.
“Overall, the percentages for ROE and ROA are acceptable and may show more of the returns we will see in the future, provided interest rates, commodity prices and inventory levels all get on the same page and have a year like the 2024 study,” Kleoppel says.