Deere & Co. is set to release its Q1 2025 earnings on February 13, 2025, and analysts are expecting the company to reaffirm its full-year forecast. The company’s stock has outperformed the broader market, up 11% compared to the S&P 500’s 3% gain. Factors contributing to this strong performance include a $30 billion aid package for U.S. farmers, which is expected to boost farm income by 30% year-over-year in 2025, and a growing narrative that U.S. agricultural commodity imports could be used as a negotiating tool against trading partners, especially China.
Despite the positive trends in agricultural equipment stocks, earnings and margins for companies like Deere, AGCO, and CNH are anticipated to be weak in the first half of 2025. The market has already factored in a potential earnings downturn, with many short-sellers beginning to cover their positions as a result of stronger-than-expected stock performance in recent weeks. The agricultural equipment sector has seen a rally, particularly after all three major manufacturers indicated that 2025 would mark the bottom of the current cycle.
The short-term outlook for Deere remains cautious, though the company may benefit from the upcoming farmer aid package and potential easing of comparisons later in the year. Analysts believe the stock might trade at a lower multiple in the near term, reflecting a trough phase, but this could be offset by positive commentary and financial benefits from the aid package in the second half of the year. The macro risk posed by proposed cuts to crop subsidies and potential tariffs on imports, particularly EU products, remains a concern.
Overall, Deere’s performance is expected to align with broader industry trends, with weak earnings anticipated for the first half of 2025 but the potential for a recovery in the second half. The company’s outlook will depend on the continued success of agricultural aid programs, as well as any regulatory changes regarding crop subsidies and tariffs.
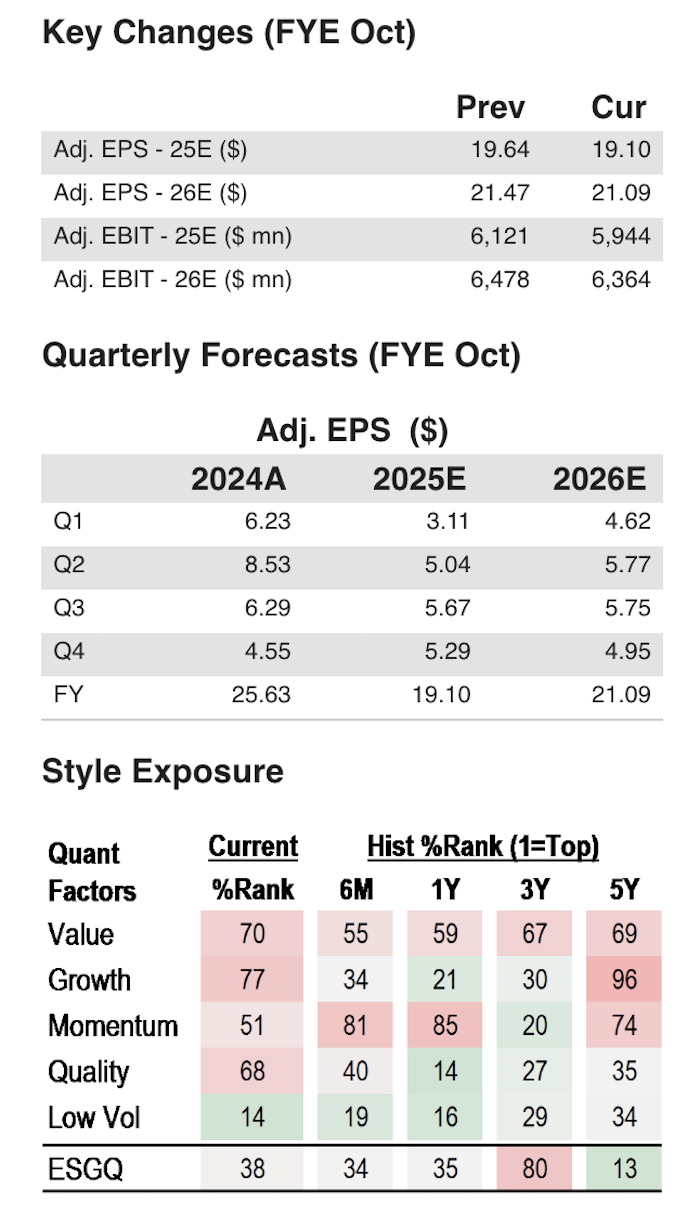
Sources for: Style Exposure – J.P. Morgan Quantitative and Derivatives Strategy; all other tables are company data and J.P. Morgan estimates.
Click here for the full document and disclaimers.