Many dealers remember how used equipment began to sit on lots in 2013-14, driven by rising commodity prices, low input costs and a notable increase in the supply of new equipment. This spelled trouble for the used market, with some equipment sitting for over a year before it moved. And with 2022 opening with some of the same signals (high commodity prices, strong demand for new units), Director of Data Services and Software Development at Iron Solutions Cameron Hurnard raises the question: are we headed right back to where we were in 2014?
The short answer is: probably not. Not all the parameters that caused the glut in 2014 are present now, particularly low input costs and producers’ gross revenue surpassing their costs. However, it’s worth looking back at what triggered the oversupply of used equipment then and examining the indicators that could help the industry avoid a similar situation in the future.
What Happened in 2014?
“We had very high commodity prices, and we had low input costs. Producers were making money,” says Hurnard. “We also started to see manufacturers try to take advantage of the situation, with producers having money in their pocket and looking to spend it. We ended up with above average demand, and manufacturers were able to ramp up their production to meet that demand. Then we may have ended up with a little too much supply.
“We had a lot of excess supply at the time and ended up with a push market. So manufacturers started to try to come up with ways to entice producers to buy. We saw roll programs come out and multi-unit discounts, so we managed to sell new equipment maybe to producers who didn’t necessarily need it.”
According to Hurnard, this push on new equipment led to a wave of trades coming in, which didn’t see the same demand as the new equipment.
“We saw lots of used equipment sitting on dealer lots for long periods of time,” he says. “There’s stories of producers coming in to trade their new combine, and the one they had traded last year was still on the lot.”
Webinar Replay
To learn more and to watch the webinar presentation of this data, click here
2013 vs. 2021 Data
Looking at the numbers from 2013 and comparing them to 2021 (see table below), the data shows the same dangers that were present then haven’t quite appeared the same way today.
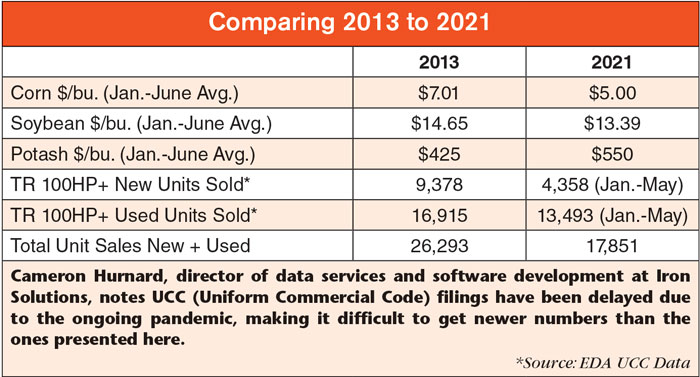
Commodity and input prices, according to Hurnard, show notable differences in 2021 than they did in 2013. Both corn prices ($7.01 per bushel in 2013 vs. $5.00 in 2021) and soybean prices ($14.65 vs. $13.39) are not quite as strong as they were then. Fertilizer prices also exceed what they were in the previous used equipment glut, with potash up 29.4% to $550 per bushel vs. $425 in 2013.
Not only that, but high horsepower unit sales for the first half of 2021 were down notably compared to the first half of 2013. New high horsepower tractor sales were down 53.5% to 4,358 units, while used sales were down 20.2% to 13,493 units.
Overall, total new and used 100+ horsepower tractor for sales the first half of 2021 came in at 17,851, a 32.1% decrease from 26,293 in 2013.
“Let’s also look at the ratios. That’s important as we try to figure out if we’re heading back into a 2014 scenario,” says Hurnard. “In the first half of 2013, 64% of total sales were used equipment, but now looking forward to the first 5 months of 2021, we’re seeing that used makes up 76% of sales. This is good for dealers not being hung out to dry with used units.
Producer Finances
Hurnard also examines producer finances going back to 2012 (Fig. 1). He emphasizes producers were making money just before the 2014 used equipment glut but aren’t breaking even currently.
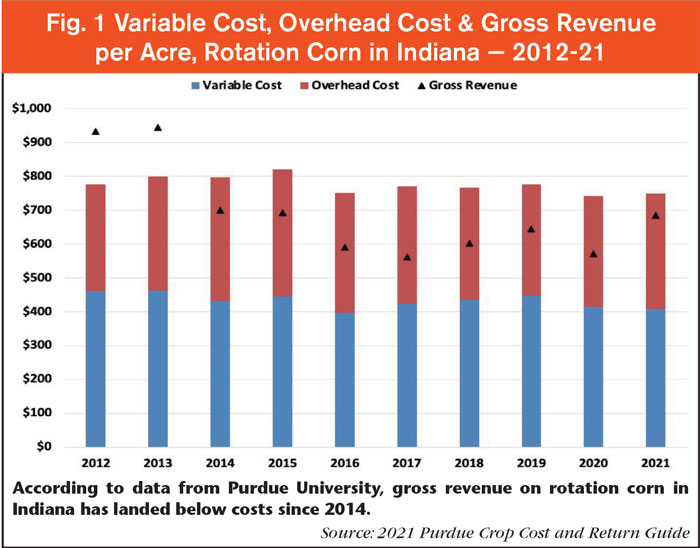
“If you look at 2013, gross revenue was north of $900 an acre, while all the costs were about $800 an acre,” he says. “There was definitely money being made back then, which drove new unit purchases. But looking at 2021, gross revenue is down to $700 an acre with our cost pushing close to $750.”
Hurnard predicts fertilizer costs will continue to rise, which will slow demand for new and used equipment (Fig. 2).
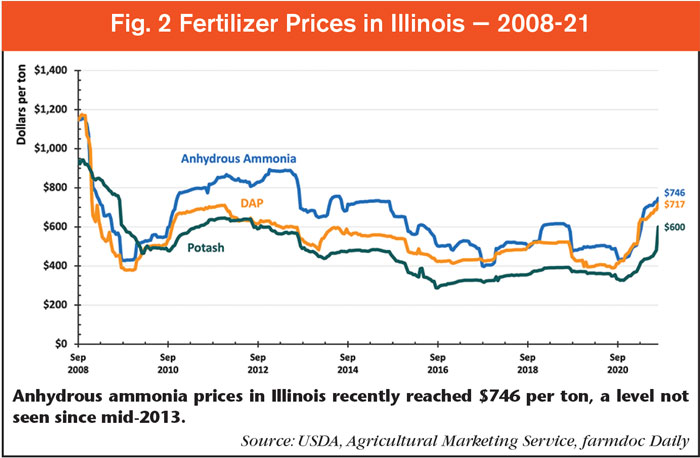
“Fertilizer was close to $450 as we said earlier, and now we’re heading north of $600,” he says. “I think these input costs are going to continue that significant upward trend, and that’s really going to hit producers hard.”
Used Combine Lot Time Declining
Using Iron Solutions’ sold reports, Hurnard shows that the number of days used combines (specifically class 7-9 combines less than 5 years old) spend on dealers’ lots has been declining since the end of 2019 (Fig. 3).
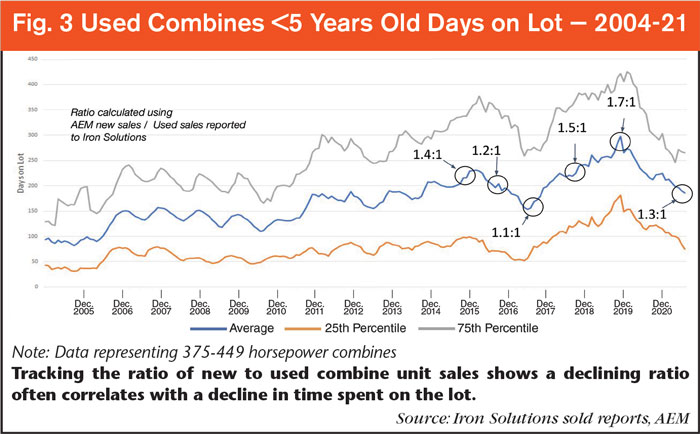
“We can see back in 2014, the number was roughly 200 days, and from 2006 to around 2011-12, the natural line it wants to sit at is about 150 days,” he says. “In 2011, it started to creep up, and from 2013-16, it also climbed.”
Data in the chart is broken down into an average of all dealers (blue), the bottom 25th percentile (gray) and the top 25th percentile (orange).
The data shows the average number of days used combines spend on lots rose again from 2017 to 2019, ending at around 300 days.
“What I find encouraging is this sharp downward trend in the time equipment is spending on lots right now,” Hurnard says. “Strong performing dealers are back to the 60-75 days range.”
Hurnard points to the end of 2015 on the average dealer line, where the ratio landed at 1.4:1.
“At that point, used combine were sitting for about 225 days. As that ratio dropped, so did the time on lots until we got down to about 1.1:1, then we’re back to 150 days,” he says. “I think it’s a great idea for dealers to track this in their own inventory and use it as one of their indicators.
“We were at 1.7:1 at the end of 2019, and now we’re down to 1.3:1. Looking at this ratio is another good indicator that we’re heading the right on the used equipment side.”
Combine Prices Volatile, but Improving
Hurnard also examines Iron Solutions’ index value of used combine retails (Fig. 4, red line), which he describes as, “representing the change in month-to-month retail selling price of used combines, adjusted for hours and age of equipment.” The index is also adjusted for seasonality, and Hurnard says these adjustments make for a more accurate comparison.
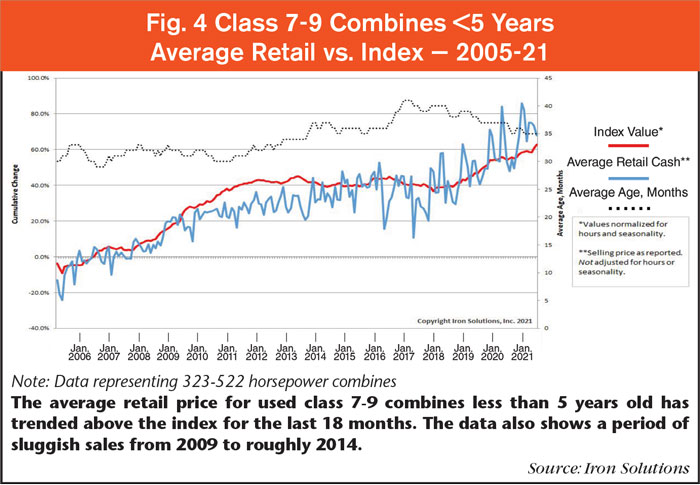
When compared with the average retail value of used combines (blue line), Hurnard says the average retail value exceeding the index indicates a stronger market and that customers may perhaps be willing to pay more than Iron Solutions’ guide would think equipment should sell for. On the other hand, average retails dipping below the index indicates a sluggish market. The dotted line indicates average age of combines in months.
“Over the last year and half, we’ve seen pretty strong demand and a lot of upside in the class 7 to class 9 combines that are less than 5 years old,” says Hurnard. “Combine age has also been fairly steady in that same period, right around the 3 year mark.”
Narrowing it down to just the class 7 combines (Fig. 5), Hurnard sees strong demand and doesn’t see it ending any time soon.
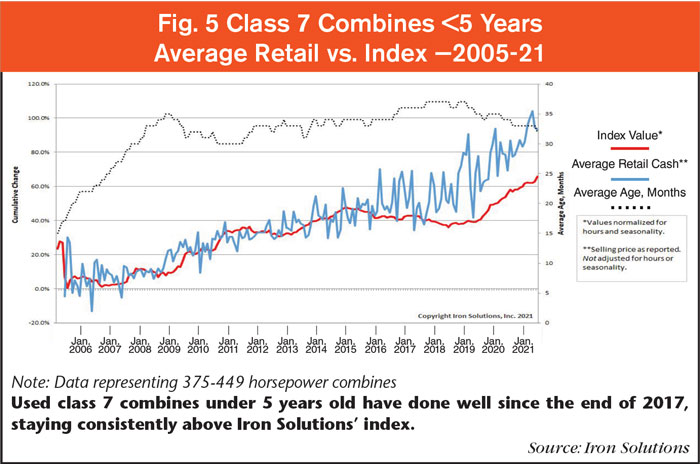
“As we look at the index number, since back toward the end of 2017, we consistently see demand on this segment has been strong and retail prices have been good,” he says. “We can see this trend start to come down a little bit over the last 3-4 months, but I don’t see any sign of this dropping off anytime soon.”
Looking at even older combines in the 5-10 year range (Fig. 6), Hurnard sees good news again in the amount of time equipment sits on lots decreasing. “We look back at 2013, just before everything took off, and we were right on that 200 days mark,” he says. “We hit a peak in summer of 2019, but now this segment is trended down pretty sharply over the last 12-15 months, almost back to that 200 days mark.
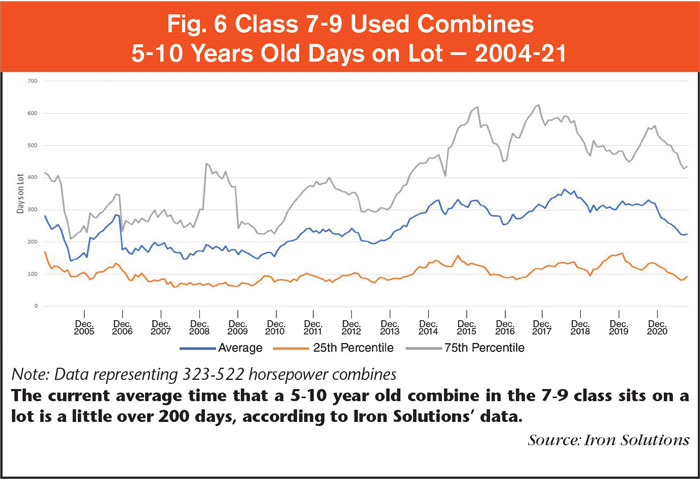
“This tells me equipment is moving back the way it should and not sitting on the lot long. There’s good demand for 5-10 years old combines right now.”
4WD Tractor Lot Times Drop
Switching over to the 4WD tractor market, Iron Solutions’ data once again shows a recent decline in the time units that are less than 5 years old spend on dealers’ lot (Fig. 7).
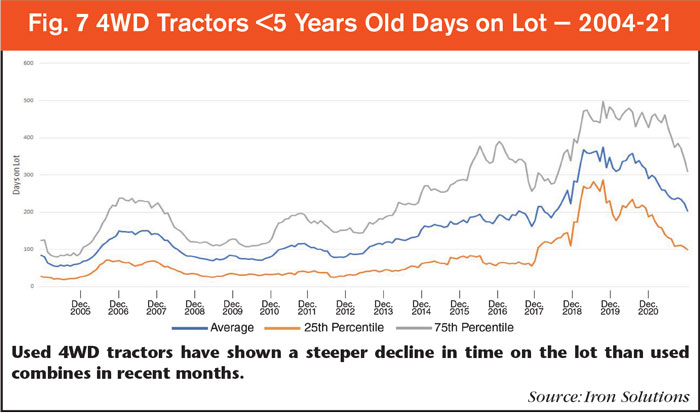
“We see a steady climb since 2013 that reached its peak around 2018. But now we’re seeing very significant demand, and these units are getting cleared off the lot much quicker than they had been,” Hurnard says. “We’re still not back to that magic number, probably around 100 days on the lot, but the trend is very strongly downward, and I don’t see any reasons for this not to continue. Perhaps by the end of 2022, we’ll get back to the 100 days mark.”
According to Hurnard, average retail pricing for used 4WD tractors, when compared with Iron Solutions’ index (Fig. 8), spells the same story as their time on lots: demand is strong.
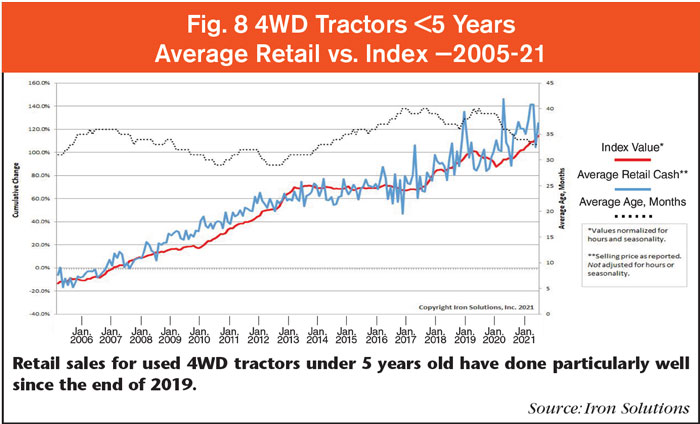
“We’re seeing average retail cash sitting well above the index number for the past 24 months or so,” he says. “This tells me once again that we’ve got good demand for these bigger units, particularly the newer ones. That should continue.”
When examining the time that older used 4WD tractors sit on lots, Hurnard notes a similar pattern to the younger units, where time trended up in 2013, peaked in 2017, rose again in summer 2020 and then started
trending downward.
“On this chart in particular (Fig. 9), what I find interesting is the strong-performing dealers [orange line] being able to keep these times right around 50 days,” says Hurnard. “They don’t have any problem moving these 5-10 year old units.
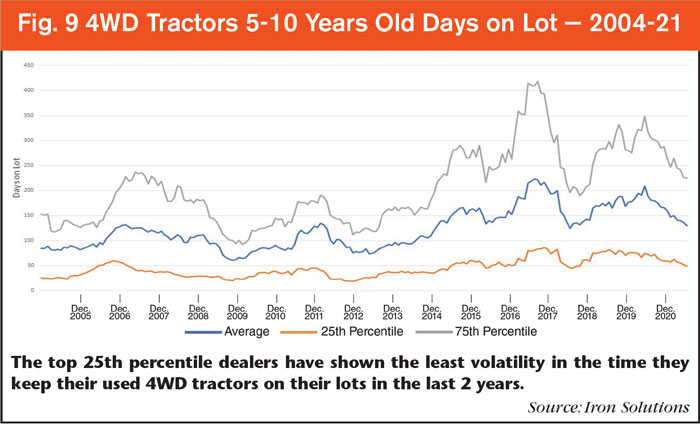
“If you’re not using all the tools you have available to you, that’s when you can run into problems getting these moved, but even that is starting to change now. Everybody’s moving 4WD tractors fairly quickly. I think we should be back to the 100 day level here in 6-8 months or so.”
Takeaways for 2022
“Are we heading for 2014 all over again? Our feeling is probably not,” concludes Hurnard. “We have high commodity prices, but they are still below what we were seeing in 2014. Another thing is increases in input costs. The struggles we’re seeing in the supply chain too is probably going to lead to more increased costs, which is going to temper the demand for units. It’ll slow down on new and used. Producers’ gross revenue is now dropping off because of this, and I think that is going to probably limit any more additional equipment purchases.”
The real “savior,” as Hurnard calls it, is the below average new unit sales, which will stave off a wave of used equipment hitting dealer lots.
“We don’t have the same situation with the manufacturers either, just pushing hard to get new equipment out the door. I think that’s going to be beneficial to us. People may end up hanging on to their used units a little longer.”
Hurnard also points to the increased demand for newer used units, which he believes will help moderate the increasing inventories on the used side.
Hurnard ultimately recommends dealers keep track of the following indicators:
- Changes in their ratio of new to used units sold
- A widening gap between producer gross revenue and input costs
- Changes in the amount of time their inventory sits on the lot
- Retail selling prices deviating from Iron Solutions’ index
Particularly for dealers noticing a growing ratio between their new and used units sold, Hurnard recommends putting programs in place to limit sales of new equipment.
“I don’t think we’re to that point yet, but it’s certainly something to be watching for. If you really see if starting to change, implement some processes to keep it in check.”