While the financial and operational performance of North American farm equipment dealers showed some improvement last year, several warning flags also popped up indicating ag machinery retailers need to sharpen their pencils and attention to finances.
This comes from data compiled by Equipment Dealer Consulting, P.C. the certified public accounting group affiliated with the Western Equipment Dealers Assn. (WEDA) and published in its 2017 Cost of Doing Business (CODB) study. This year’s survey involved 203 dealers representing approximately 672 locations.
This report summarizes some of the data and commentary covered during the webinar and compares several of the measurements presented in WEDA’s 2017 Cost of Doing Business study over a 4 year period, starting with 2014 when farm equipment sales started to decline. In some cases, a comparison of dealers by sales volume is also included.
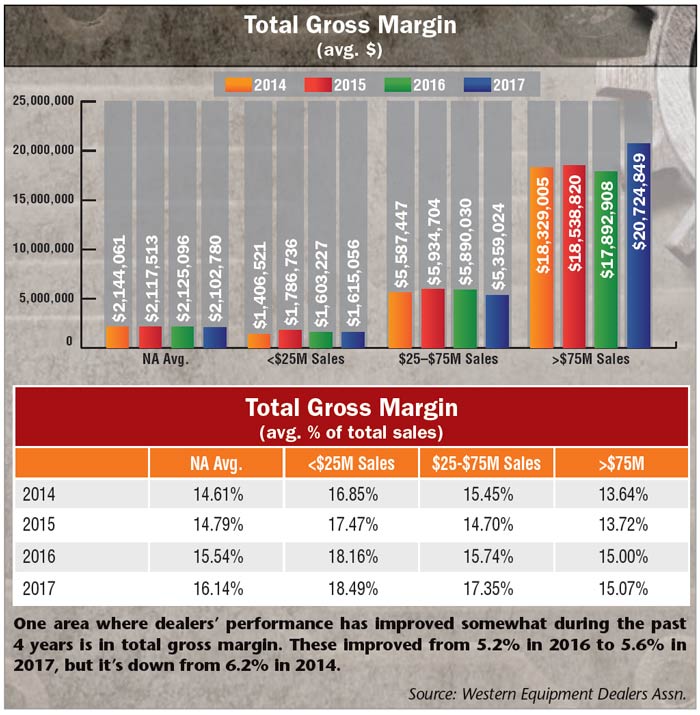
Among the positives from the data, says Curt Kleoppel, president of Equipment Dealer Consulting, were an increase in total dealer equity of 0.71% vs. a year earlier and 0.6% improvement in gross margins compared to the 2016 study. In addition, “Total inventory as a percent of assets decreased 2.23%, indicating dealers are controlling their new and used inventory,” he says.
Exclusively Online
For more details on the Cost of Doing Business Study and to view the Webinar Replay visit www.Farm-Equipment.com/0218.
At the same time, other dealer metrics are concerning, particularly the escalation in overall expenses and a drop in total profits from operations. “This is probably the most concerning aspect in this whole report,” says Gord Thompson, a retired Case IH dealer. He together with Bob Charbonneau, a CPA with WEDA since 1983, presented highlights from the study during a Farm Equipment webinar on Oct. 3, 2017, which was sponsored by the Dealer Institute, the educational arm of WEDA.
Escalating Expenses
Overall dealer expenses have been inching upward over the past 4 years even as wholegoods sales dipped. Between 2015 and 2016, on average, expenses rose by nearly 9% and that trend showed up again in the 2017 WEDA study. As a percent of total sales, total expenses rose to 15.5% in the most recent survey. This is up from 14.2% in the prior year and up from 11.8% in 2014.
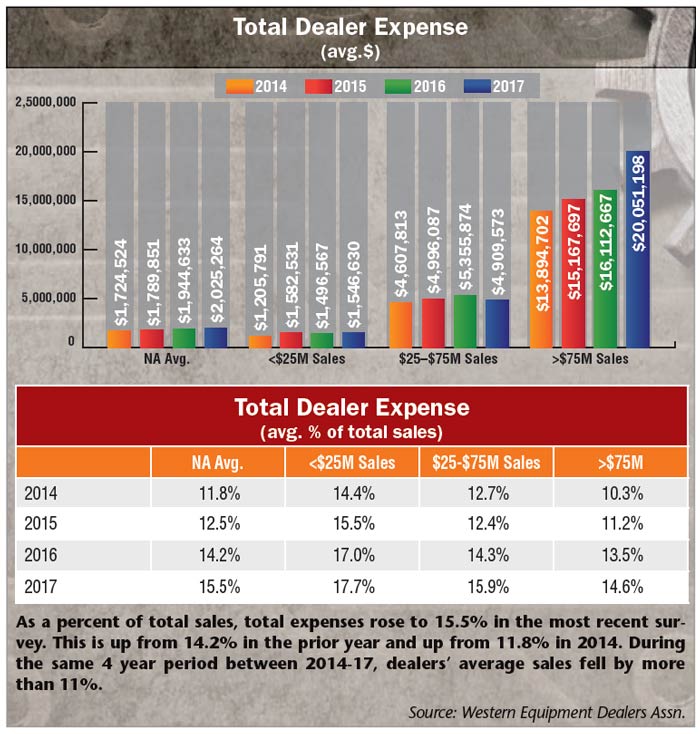
In terms of dollars, on average, dealers’ 2017 total expenses were up by nearly 4.2% vs. 2016 and up by 17.4% compared to 2014. A comparison of average dollars shows that dealers’ overall expenses in 2017 rose to $2.03 million compared to $1.94 million the year before and $1.72 million 4 years earlier.
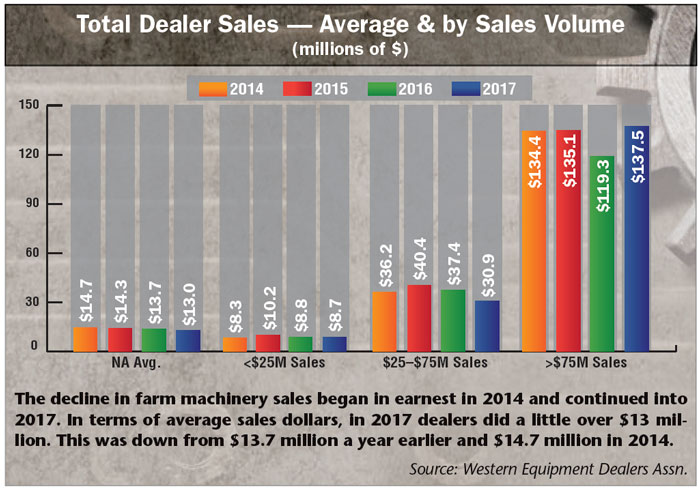
During the same 4 year period between 2014 and 2017, dealers’ average sales fell by more than 11%. The rate of decline slowed in 2017, when sales dropped by about 5.4% compared to the previous year. In dollars, 2017 total sales averaged a little over $13 million. This was down from $13.7 million a year earlier and $14.7 million in 2014.
In his commentary, Thompson said that in studying where the increases were coming from he determined “it wasn’t any one thing,” but “a little bit of everything. The general economy is probably putting pressure on wages and perhaps rents.”
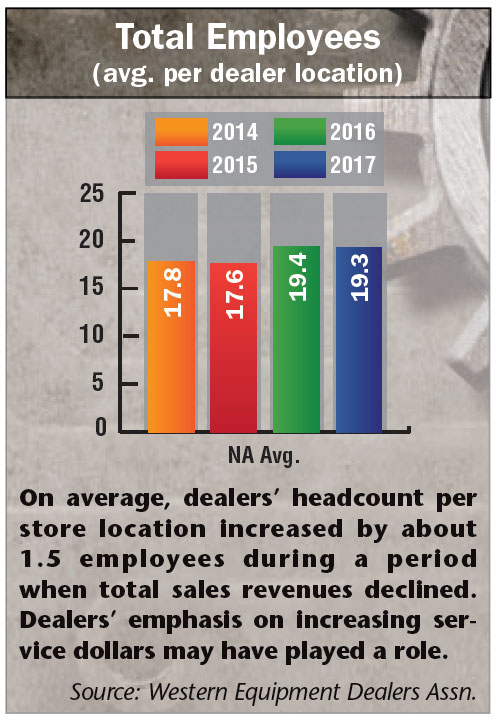
In fact, the 2017 study shows that total salaries and benefits at dealerships grew from 6.25% to 8.12% as a percent of sales during the past 4 years. That’s an increase of nearly 30%. Meanwhile, the average headcount at dealerships rose from 17.8 employees per store location in 2014 to 19.3 in the most recent study.
Rising healthcare costs could also be playing a role. More than 83% of dealers indicated they were “most concerned” or “concerned” about rising costs of healthcare benefits in Ag Equipment Intelligence’s 2018 Dealer Business Outlook & Trends report. Other factors that could be contributing, as well, to rising salaries and benefits may be the addition of service techs, particularly precision farming specialists, as dealerships try to bolster their bottom lines with higher service revenues.
Dollar wise, between 2014-17, total salaries and benefits grew from $917,429 to $1,058,370. That’s an increase of nearly 16%. Comparing 2017 to 2016, the increase was about 4.7%. More importantly, Thompson points out that the industry is down to about $677,000 in gross sales per employee.
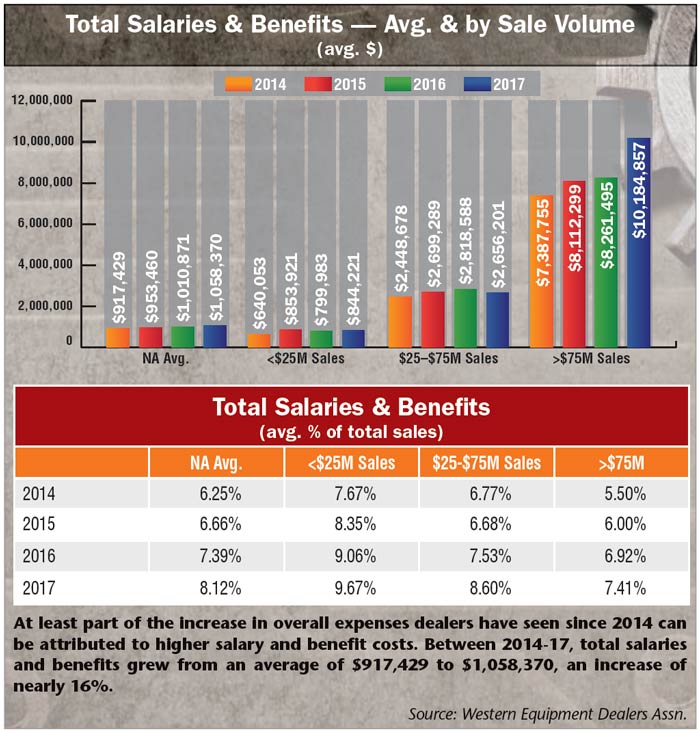
“I always targeted a million bucks when I owned the dealership. Perhaps it was an easier market back then, but we certainly got it. And since 2014 sales per employee has declined 18%. We certainly know there’s been inflation on equipment in that time period, which makes it even worse. So, sales per employee has declined while employee count has increased. I’m not sure what the answer to this issue is, but dealers need to address it,” he says.
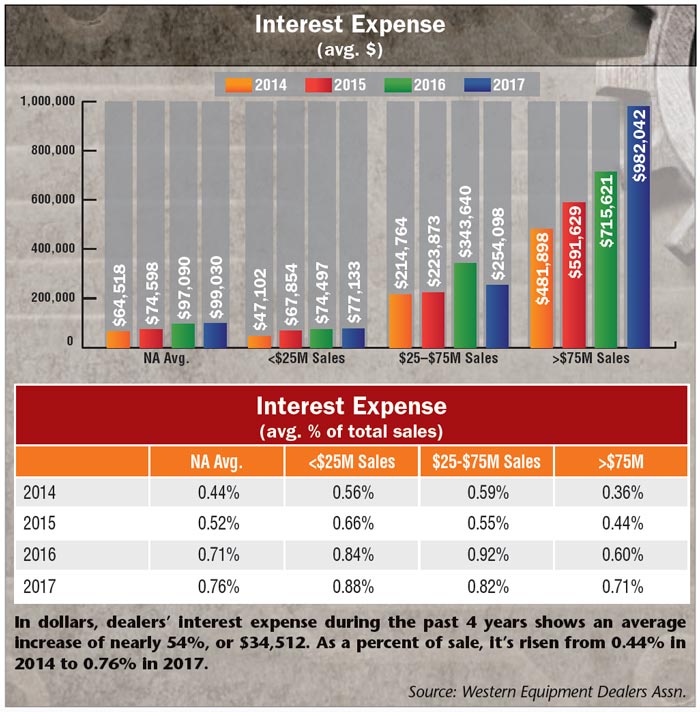
Charbonneau also noted that interest expense has risen significantly since 2014, both in dollars and as a percent of total sales. Comparing interest expense during the past 4 years shows an average increase of nearly 54%, or $34,512. As a percent of sale, it’s risen from 0.44% in 2014 to 0.76% in 2017.
“Unfortunately, if we want to use leverage we’re going to have interest expense, but it doesn’t make anything run better or look better or it doesn’t improve any company assets. So, we need to minimize it as much as we can,” says Thompson.
Nonetheless, he finds the rise of interest expense puzzling. “It’s gone up in a year when there was a significant decrease in wholegoods inventory levels, which is often the biggest driver of interest expense.” He suggests that this could be the result of rising interest rates.
All in all, Thompson says these trends should give dealers reason to be concerned. “We’ve got to find a way to balance this because it isn’t a trend we can weather. We’ve got to get it on track. One of the ways I advocate is zero-based budgeting.”
This is a method of budgeting where incremental increases to line items aren’t simply approved. Instead all expenses start at zero and every function within the company are closely analyzed and justified for its needs and costs.
How to Get the 2017 Cost of Doing Business Study
To obtain the complete 2017 Cost of Doing Business study, dealers must contact their state or regional equipment dealer association. The 2017 report has been sent free of charge to equipment dealers that provided their confidential financial reports for compilation. Non-participating dealers can purchase the results for $200 ($275 in Canada) if they are association members; the report is $450 ($525 in Canada) for non-members.
Participating dealer associations for the 2017 edition are the Deep South Equipment Dealers Assn., Far West Equipment Dealers Assn., Iowa-Nebraska Equipment Dealers Assn., Midwest-SouthEastern Equipment Dealers Assn., Northeast Equipment Dealers Assn., United Equipment Dealers Assn. and the Western Equipment Dealers Assn.
For questions or to learn more about how to access the survey results, please contact Lonnie Finch, CPA, Equipment Dealer Consulting LLC at 800-762-5616, email lfinch@westerneda.com.
“I think you would be surprised when you sit down with your people and really analyze where you’re spending your money, what you need to do and what you don’t need to do,” says Thompson. “Even if you can save 5%, it’s huge. I would urge dealers to give this consideration because the rising expenses is probably the most concerning thing I see in this whole report.”
Dwindling Profits
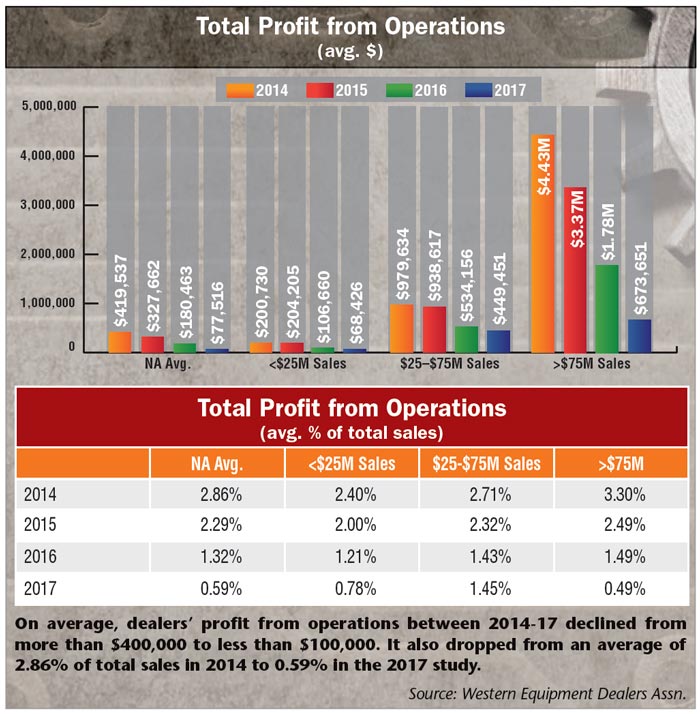
All of these factors and more have resulted in diminishing dealer profits. Charbonneau points out that total profit from operations in 2017 were down considerably from 2016, both in actual dollars and percent of sales. In fact, he says, “It’s decreased every year over the last 4 years.”
According to Thompson, this is largely due to rising expenses. “It’s the biggest decline line in the report for sure. It’s getting real thin. We’re showing a decline in profit from operations of $340,000 over the last 4 years and, in the meantime, expenses are up over $300,000 over that time, while total gross margins have only decreased $40,000.
“We thought that margins were our primary challenge. While margins are tough, our expenses are now the biggest factor in lower profitability. We need to figure out how we can deal with this because we either have to get our margins up or lower our expenses because the sum of the two isn’t working very well.”
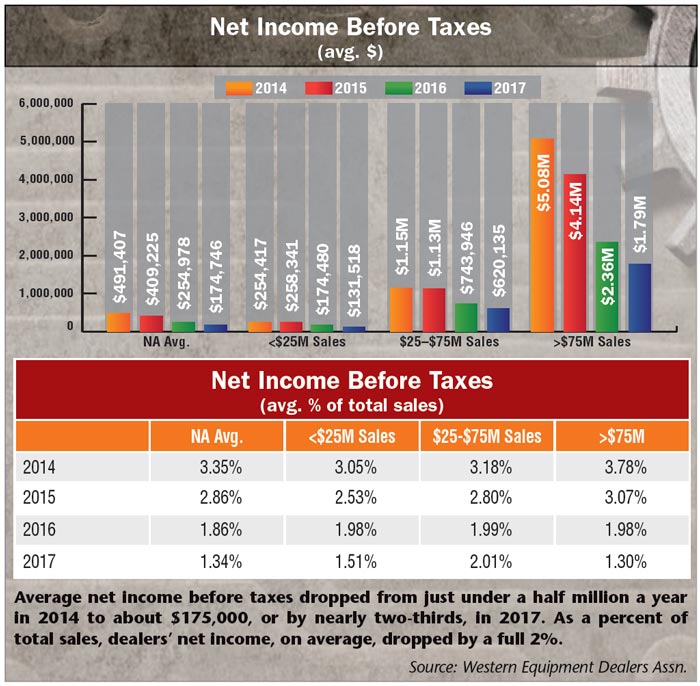
Ultimately, the ongoing challenge of rising costs have wreaked havoc on dealers’ bottom lines. Average net income before taxes dropped from just under a half million a year in 2014 to about $175,000, or by nearly two-thirds (approx. $317,000). Between 2016-17, the decline was about half of that, or nearly one-third. As a percent of sales, net income fell from 3.35% to 1.34% during the past 4 years.
Volume Bonus Not the Answer
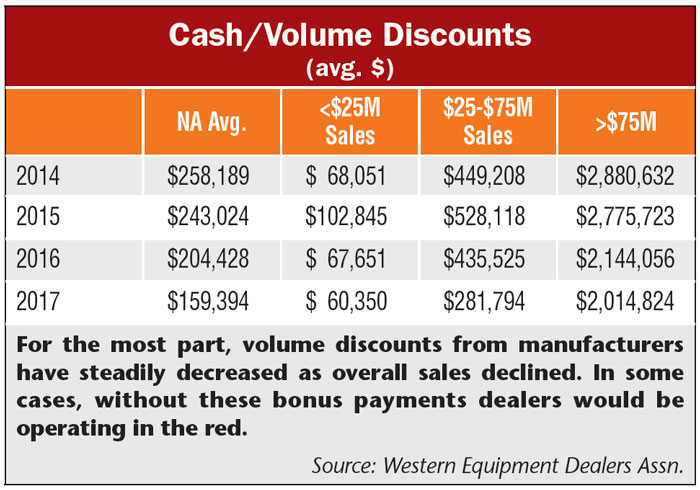
As sales of farm equipment have continued to slip, in some cases, dealers will look to volume discounts from manufacturers to secure their bottom lines. But Thompson says relying on such “bonuses” is not a good long term strategy. Without them, dealers will often find themselves solidly in the red.
For example, he points out that in 2017 the average volume bonus for North American dealers was $159,000. “That put profit from operations in the hole by $81,000 before volume discounts.
“When I owned my dealership, one of my real baseline targets was to get profit from operations positive before volume discounts. One of the reasons this concerns me is that we’ve seen some manufacturers really change their minimum thresholds on volume bonus significantly in recent years. It’s hard to build a business model on making money on volume when you don’t know what you’re going to get on volume,” says Thompson.
“I’ve heard of situations where manufacturers have raised the minimum threshold several million dollars in one year. That’s taken some dealerships right out of the volume equation. Looking at the average numbers, that’s not a good scenario if you’re on the negative before you get volume. I think we have to find a way to work our way through this.”
Return on Equity & Assets: Bleak
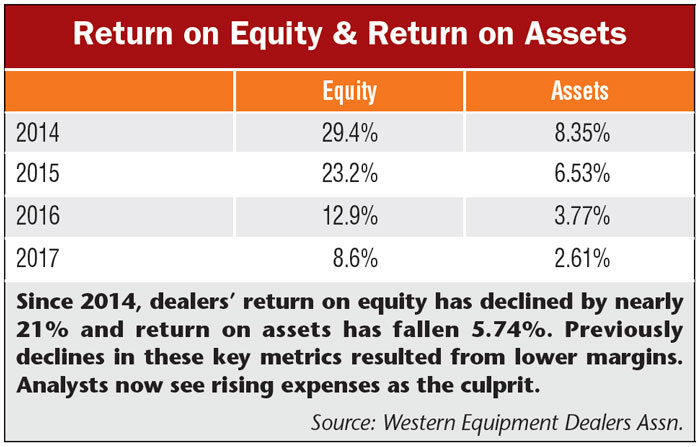
Two of the key measurements of operational performance — return on equity and return on assets — reflect farm equipment dealers’ ongoing difficulties with declining sales. With return on equity falling from 29.4% in 2014 to 8.6% in the 2017 study, Charbonneau calls this “another kind of bleak picture. There was an almost 21% decrease over the 4 year period and a 4.3% decrease from 2016 to 2017.”
Return on equity is a calculation of net income before taxes divided by average net worth, which is a measurement of the productivity of an owner’s investment. Thompson says this, again, is the result of increasing expenses. “Bankers and potential investors are very interested in this number and it drives the value of the business. This should be reason enough to work to improve it, but, of course, we all want to do this, regardless.”
Return on assets, another key operational measure, is a calculation of net income before taxes divided by average assets. It reflects a company’s ability to utilize its assets to earn a profit. This metric declined from 8.35% in 2014 to 2.61%, a decrease of 5.74%.
“It seems that some of the bigger dealers are more aggressive than we used to be, and certainly more aggressive than I ever was in terms of pulling the trigger on used inventory,” explains Thompson. “They’re prepared to dump it at no profit fairly quickly if they can’t get it out the door fast. They want to dramatically increase turns and we’re seeing a lot of focus on doing this.
“And if you have to take a hit on margin on some stuff in order to get your turns higher, then we’d better get on with it because we can’t control the price very much. The margins are more or less set by the market and the margins are tough. So, it’s the combination of turns times margin that really matter at the end of the day because it’s the multiple of the two that hits your bottom line,” Thompson adds.
“If you have a great margin but you only turn it once, that doesn’t produce a good outcome. But if you have an okay margin and you turn it 4 times, it’s going to work pretty well. It substantially lowers your risk and it substantially cuts your risk in a changing market, as well as carrying costs. It’s a difficult choice, but it’s something dealers need to consider.”
Making Progress in Inventories
While it’s clear that North American farm equipment dealers have work to do to shore up profits, much of which needs to focus on the expense side, they have improved some areas of their operation. The most noticeable is the reduction in wholegoods inventories.
On the new equipment side of inventories, new equipment backlog is down by $408,000 during the year between the 2016 and 2017 studies. As a percent of sales, it dropped from 45.09% to 42.96%. For used equipment, inventories are down nearly $265,950 on average. As a percent of sales, used equipment backlogs dropped nearly 2%. Overall, inventories fell from 71.21% to 67.39% as a percent of sales, or 3.82%. On average, total wholegoods inventories in the 2017 study were down $674,145 vs. the 2016 report.
“Wholegoods inventory increased a million dollars over the prior 4 years and now it’s down by nearly $675,000 in the last year. This is really good,” says Thompson. “We knew this was something that absolutely had to happen. As it’s reflected to [inventory] turns, it’s still got room for improvement, but it’s definitely a step in the right direction.”
Another area where dealers have made some progress was in wholegoods margins. “We saw a small improvement in used equipment margins,” says Thompson. “This means dealers aren’t taking as many hits on used equipment.”
Margins on previously owned machinery increased from 1.6% in the 2016 study to 2.5% in 2017.