Editor's Note: USDA released its Agricultural Projections to 2025 this past week. If the current outlook holds, it could be good news for farm equipment dealers. According to the report, farm net income, which ultimately determines if farmers will invest in capital expenditures (equipment, buildings, etc.), will bottom out in 2016 and begin a gradual rise for the next decade. In all likelihood, it will not reach the levels seen in 2013 and 2014, but it will be an improvement vs. 2015 and 2016.
U.S. Farm Income
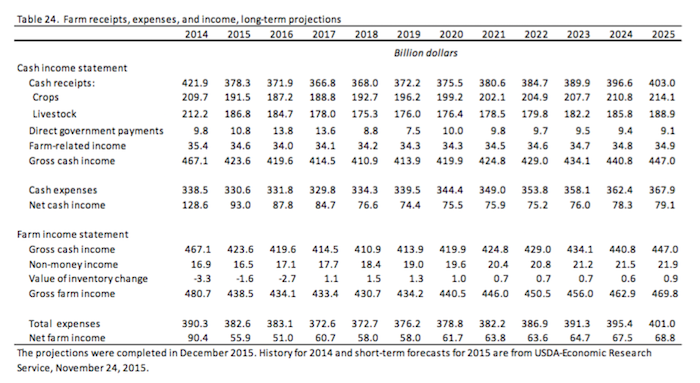
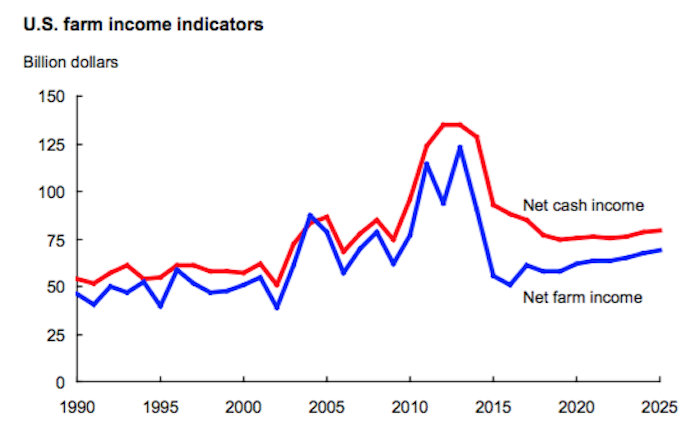
Net cash income and net farm income initially fall from recent record highs. Net cash income declines through 2019 before generally rising over the latter part of the projection period. Net farm income, which through 2015 fell more sharply from its peak, generally rises after 2016.
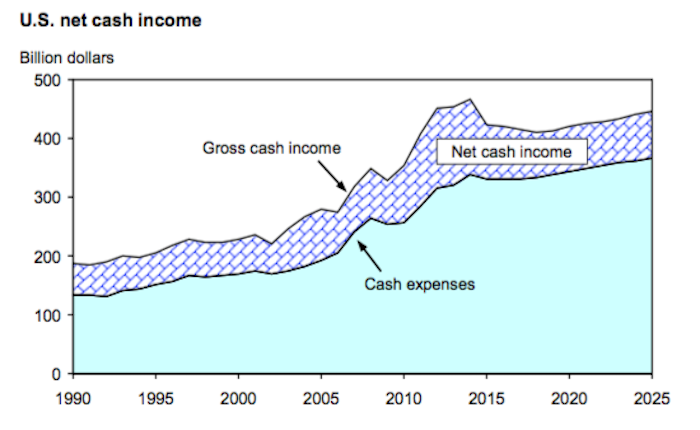
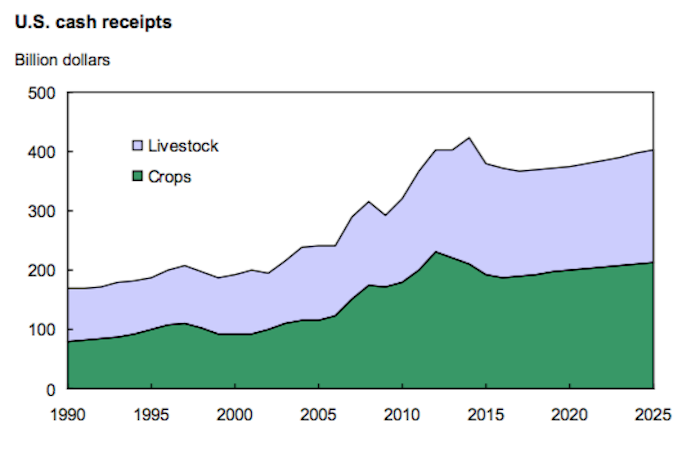
- Projected reductions in prices for most major crops and livestock result in declines in farm cash receipts in 2015-17. Crop cash receipts fall through 2016, while livestock cash receipts decline through 2018. Cash receipts then grow over the rest of the projection period as steady domestic and international economic growth support longer term demand for U.S. agricultural products.
- Total direct Government payments are projected to increase to more than $13 billion in 2016 and 2017, largely reflecting lower crop prices that push up payments under the Agriculture Risk Coverage (ARC) and Price Loss Coverage (PLC) programs of the Agricultural Act of 2014. Government payments then fall in 2018 and 2019 as commodity prices begin to rise. Government payments are projected to increase again in 2020 before falling over the remainder of the projection period.
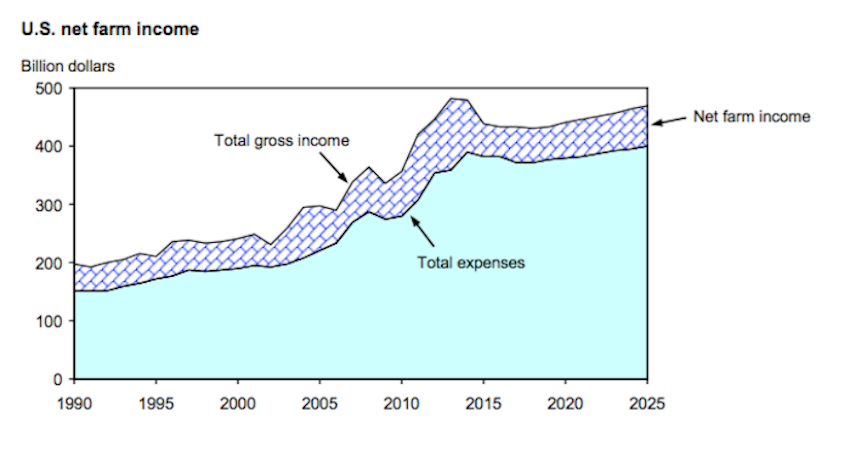
- Total farm production expenses and cash expenses fell in 2015 as declines in feed costs and energy-related input prices combined with reduced acreage to lower expenses for farm-origin and manufactured inputs. Farm production expenses are projected to increase after 2017 as crude oil prices and interest rates rise.
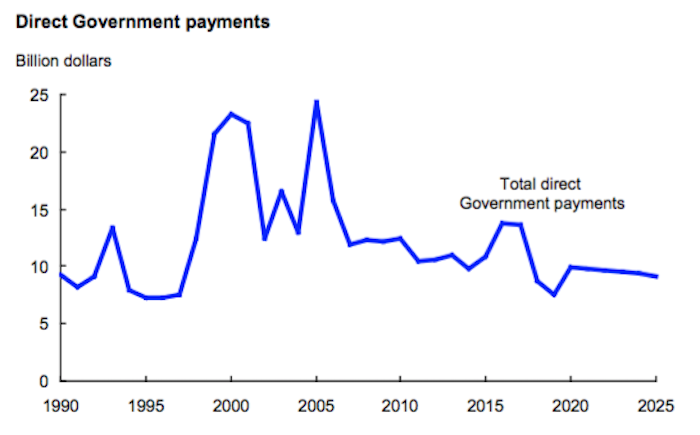
Direct Government payments to farmers rise sharply in 2016, mostly due to ARC and PLC payments under the Agricultural Act of 2014. After falling to $7.5 billion in 2019, direct Government payments rise again in 2020 and average less than $10 billion per year over 2020-25, compared to an annual average of more than $15 billion in 2001-10. The Conservation Reserve Program (CRP), ARC, and PLC provide the largest direct Government payments to the agricultural sector over the projection period.
- Acreage enrolled in the CRP is assumed at slightly less than its legislative maximum of 24 million acres under the Agricultural Act of 2014. As crop prices begin to rise again, average rental rates for land in the CRP will also increase. As a result, CRP payments are projected to increase from about $1.8 billion in 2015 to $2.4 billion in 2025.
- Payments under the ARC and PLC programs total about $9 billion annually in 2016 and 2017, reflecting reductions in crop prices from relatively high levels of recent years. While these payments fall in 2018 and 2019 as crop prices rise, they jump to nearly $5 billion in 2020 as some producers are assumed to shift to PLC. (The initial producer election of ARC or PLC under the Agricultural Act of 2014 covers 2014-18 crops. For projections beyond those years, another enrollment election is assumed to be available for 2019-25 crops.) These payments and overall direct Government payments to farmers then fall over the last 5 years of the projection period, again reflecting rising crop prices.
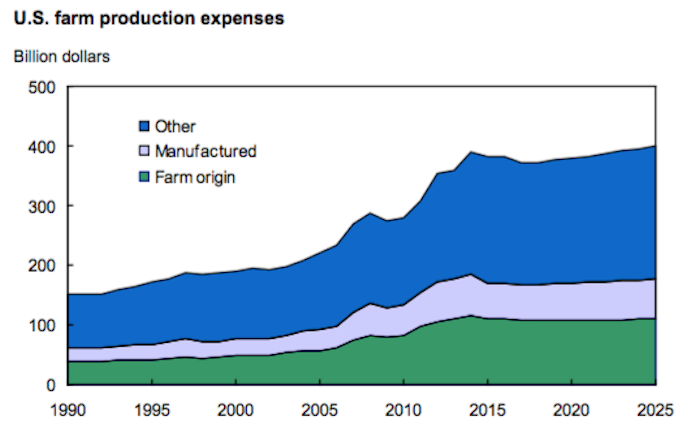
Total farm production expenses fell in 2015 as declining agricultural commodity prices reduced farm-origin costs, while lower planted acreage and crude oil prices reduced manufactured input expenses. Production expenses rise after 2017, although increases are less rapid than the overall rate of inflation through 2025. While interest expenses and fuel and oil costs rise faster than the general inflation rate during these years, expenses for farm-origin inputs and other manufactured inputs are up less than the general inflation rate. Aggregate expenses for other nonfarm-origin inputs increase at rates somewhat below the overall inflation rate.
- Interest costs rise faster than the general inflation rate over the projection period, reflecting rising farm debt levels as well as increasing interest rates due largely to tightening monetary policy.
- Production expenses for fuel and oil also rise faster than the general inflation rate after 2017, largely reflecting increases in crude oil prices. Reductions in planted acreage in 2016-17 combine with anticipated higher domestic nitrogen fertilizer production capacity and relatively low natural gas prices to lower fertilizer expenses slightly in this period, with these costs rising more slowly than the general rate of inflation later in the projection period.