While farm cash receipts is a good indicator of farmers’ ability to invest in new ag machinery, it’s usually net farm income that tells them to pull the trigger on equipment and other capital purchases.
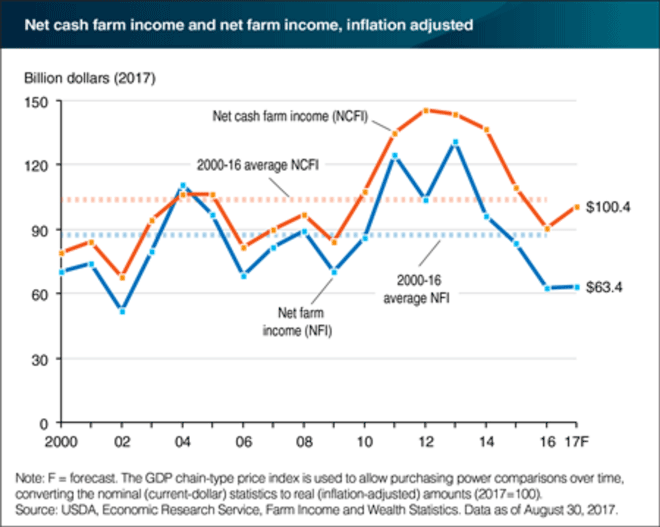
Last week USDA issued its outlook for net farm income for 2017, and for the first time in several years the ag agency is projecting an increase, albeit a small one. USDA’s report, issued on Aug. 30, says, “After several years of declines, inflation-adjusted U.S. net farm income is forecast to increase about $0.9 billion (1.5%) to $63.4 billion in 2017, while inflation-adjusted U.S. net cash farm income is forecast to rise almost $9.8 billion (10.8%) to $100.4 billion.”
The agency says the expected increases are led by rising production and prices in the animal and animal product sector compared to 2016, while crops are expected to be flat. The stronger forecast growth in net cash farm income, relative to net farm income, is largely due to an additional $9.7 billion in cash receipts from the sale of crop inventories. The net cash farm income measure counts those sales as part of current-year income, while the net farm income measure counts the value of those inventories as part of prior-year income (when the crops were produced).
“Despite the forecast increases over 2016 levels, both profitability measures remain below their 2000-16 averages, which included surging crop and animal/animal product cash receipts from 2010 to 2013,” the USDA says.
Net cash farm income and net farm income are two conventional measures of farm sector profitability. Net cash farm income measures cash receipts from farming as well as farm-related income including government payments, minus cash expenses. Net farm income is a more comprehensive measure that incorporates non-cash items, including changes in inventories, economic depreciation and gross imputed rental income.
Report Analysis
Following release of the USDA report, University of Illinois Dept. of Agricultural and Consumer Economics, Todd Kuethe and Todd Hubbs, along with Dwight Sanders of the Dept. of Agribusiness Economics at Southern Illinois University, in an Aug. 31 post in Farmdoc Daily analyzed the agency’s forecasts and estimates since 1975.
“The increase in net farm income forecasts may come as a surprise for many observers in the Corn Belt, as the region continues to experience lower crop prices, yet the increase between the February and August projections is driven, in large part, by changing expectations in the livestock sector. For example, forecasts for 2017 cash receipts in animals and animal products increased 8.4%, while the forecast for crop cash receipts increase a mere 0.3%,” say the authors.
They maintain that the improved outlook for 2017 is not unique. “Between 1975 and 2016, the August forecast revision came in higher than the February forecast 60% of the time. The 1.8% improvement, however, was moderate by historical standards. Between 1975 and 2016, the August forecast exceeded the February forecast by 6.8% on average.
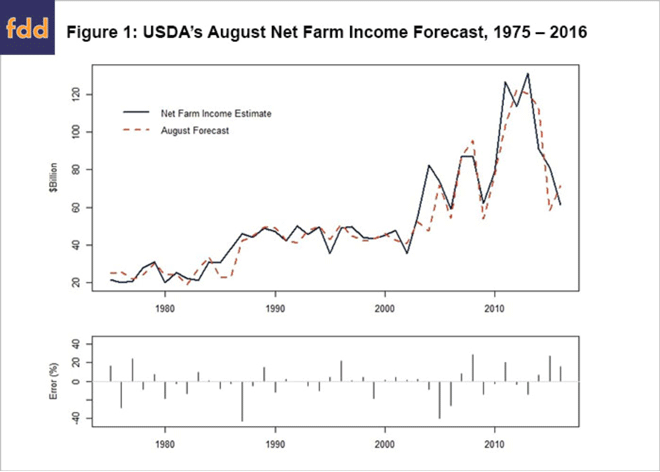
August Forecast History
The farmdoc daily article of Aug. 25, 2017 showed that the August forecast tends to under-predict the final net farm income estimate. According to the authors of the Aug. 31 report, in years when the USDA forecast improves between February and August, the August forecast tends to over-predict realized net farm income estimates.
“Similarly, when the USDA projections fall between February and August, the August forecast tends to under-predict net farm income. The change in expectations between February and August are informative of the accuracy of the August forecast, and the August revision tends to be a bit too extreme. "Thus, the 1.8% improvement in 2017 net farm income forecasts between February and August suggests that realized 2017 net income is likely to be below the current projection,” say the report authors.
They point out that this pattern can also be observed for 2016 net farm income. The USDA's official estimate of 2016 net farm income was $61.5 billion. The USDA initially forecast net farm income at $54.8 billion in February 2016. In August 2016, USDA raised their projection to $71.5 billion, a 30.5% increase between February and August. The initial forecast was 10.9% below realized net farm income, yet the August forecast revision was 16.3% above the eventual official estimates.
The authors conclude, “The most recent USDA net farm income forecast suggest that 2017 is expected to exceed official estimates of the previous year for the first time in three years. The history of the USDA's net farm income forecast, however, suggests that current growth projections are likely to moderate throughout the remainder of the forecast period.”