What is the connection among Nebraska Tractor Tests, Moore’s Law and the second half of the chess board?
Over the last 5 years, this column has focused on specific applications of technology that benefit farm equipment dealerships and we’ve cited specific operating numbers that the best dealers achieve. But this edition of “Technology for Profit” is different — it focuses on concepts, historic trends and changing perspectives of the future.
The intent here is to look forward and to sensitize dealers to changes that will affect their business, sooner rather than later. The title and call to action “Are You Ready for the 2nd Machine Age” is taken from recent and seminal book called, “The 2nd Machine Age — Work, Progress and Prosperity in the Time of Brilliant Technologies” by MIT professors Erik Brynjolfsson and Andrew McAfee.
Farm machinery dealers’ business reflects farmers’ use of machines they sell and support. Farm machinery is a key part of the 1st Machine Age and the Industrial Revolution. Even before the 1830s when inventors like Cyrus Hall McCormick, John Deere and Jerome Increase Case began the modern age of farming, evolving equipment allowed a farmer to move beyond the limits of his muscles and to begin to replace people with labor saving machines.
We are already well into the 2nd Machine Age where the benefits of digital technology will allow farmers to move beyond the limits of their minds. The question and challenge for dealers is whether they’ll be ready to conceive of and take advantage of the opportunities and changes necessary for their businesses in the next part of the 2nd Machine Age.
1st Machine Age=Horsepower
Chart 1 shows the average horsepower of tractors tested at the Nebraska Test Lab. The increase in average horsepower since the 1920s illustrates that the machines in the 1st Machine Age were developed to simply increase the ability of one farmer to do more. In the U.S., in large part due to the development of mechanized farm machinery, one farmer can feed 155 people, more than double the 72 they could feed 40 years ago.
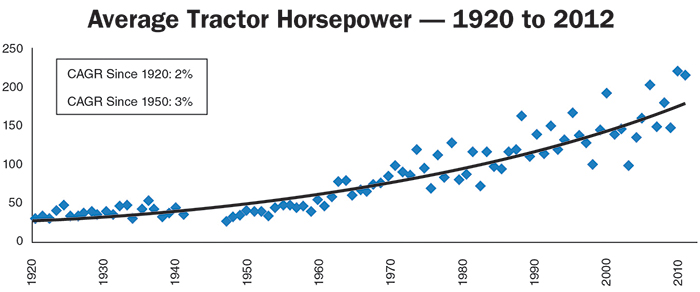
CHART 1. The increase in average horsepower since the 1920s illustrates that the machines in the 1st Machine Age were developed to simply increase the ability of one farmer to do more. Source: Nebraska Tractor Test Lab, Lincoln, Neb.
This chart shows that the size of machines is about adding horsepower incrementally, increasing machine size and, thus, improving productivity. (Thanks to R.W. Baird for the idea of this chart.)
As farm equipment dealers, your business is to support these fewer, larger machines, but your own business is limited by the limits on productivity. There are only so many hours that a technician can bill out a year, and there are limits to the time that a sales rep or a parts counter person can sell in a day. The productivity of your employees is constrained by time. If you want to sell more, and your employees are at their physical limits, you can only do so by adding more people. The nature of 1st Machine Age technologies is that it’s additive. You will understand the implications of this as we discuss the 2nd Machine Age in the next part of this column.
2nd Machine Age=Computing Power & Moore’s Law
Where the 1st Machine Age is about physical force and energy, like horsepower, the 2nd Machine Age is about electronic based information and communication power. It’s what I call “computing power.” Moore’s Law is the key to the 2nd Machine Age. Note that the scale shown on the left in Chart 2 is logarithmic, where each unit of measure is 10 times the previous unit.
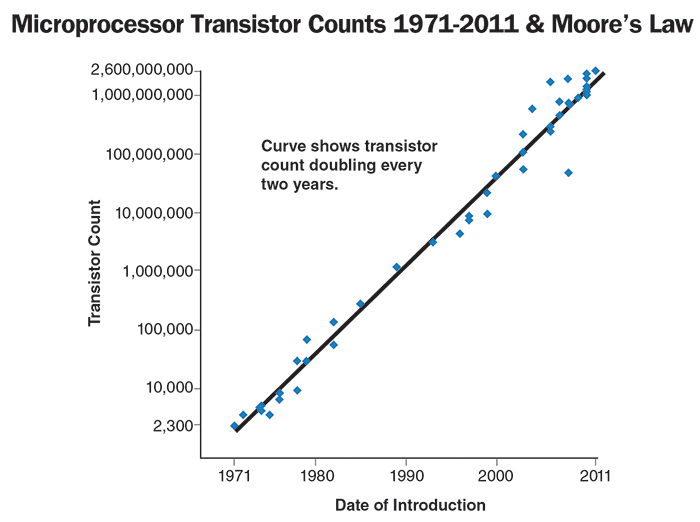
CHART 2. In 1965, Gordon Moore, co-founder of integrated circuit maker Intel, predicted the power of integrated circuits would double every 18 months. Experts say this doubling will continue until at least 2030. Source: Wikipedia
The co-founder of the large integrated circuit maker Intel was Gordon Moore who, in 1965, predicted that the power of integrated circuits would double every 18 months. Since 1971, he has been proven to be correct. Experts say this doubling will continue until at least 2030.
For farm machines, as with any modern technology, Moore’s Law means that machines are more electronic, smarter and more connected.
For a dealer’s business, the working tools are also more electronic based: you use smartphones, GPS and personal computers and are more connected to your customers, employees and vendors.
2nd Half of Chess Board=Taking a Sharp Turn
In the 1st Machine Age, technology applications expanded by simple “additions.” In the 2nd Machine Age, technological applications “multiply” in an exponential fashion. That is they expand by orders of magnitude.
Comparing 1st Age Horsepower with 2nd Age Computing Power requires the use of a logarithmic scale because of the vast differences in how technology expands in one age compared with the other. In Chart 3, the left and right hand charts are the same data and each compares horsepower to computing power. The chart on the left uses a logarithmic scale, while the chart at right is a standard scale where 20 million is the difference between lines.
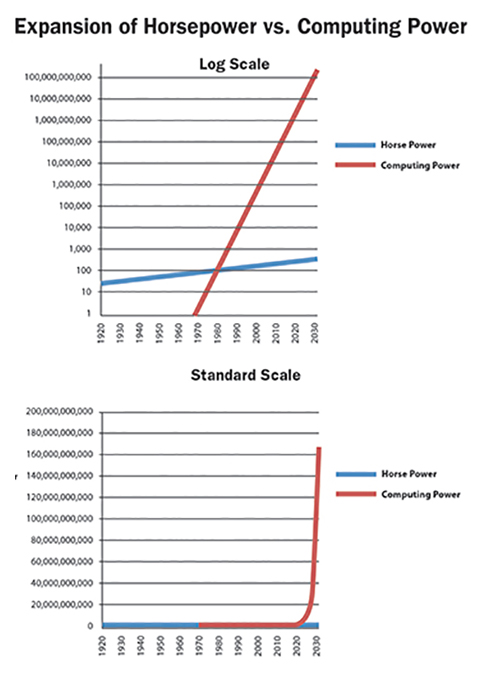
CHART 3. The data in each of these charts compares horsepower to computing power. The chart on the left uses a logarithmic scale, while the chart at right is a standard scale where 20 million is the difference between lines. On the left, horsepower starts at 25 and grows additively. On the right, computing power is shown as it grows exponentially.
Note that the horsepower line begins in 1920 at 25 HP and grows additively at a rate of 2% and then to 3% (see Nebraska Tests chart). If increasing at the same rate, average tractor horsepower would be 300 by 2030.
The chart depicting the expansion of computing power begins in 1971 and increases exponentially to a huge number. In fact, the number is so large, most of us have never heard the term used to describe it. (See Table 1.). Think of computing power as the exponential increases stated in Moore’s Law as they relate to memory, processing speed, even number of pixels on a digital camera. The number is a proxy for all of those.
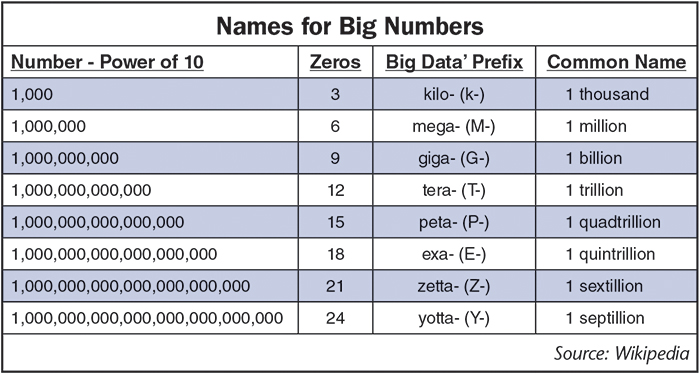
The right hand chart is the most important because it also illustrates the 2nd half of the chess board. This refers to the legend that the inventor of chess who bargained with a king for his reward for his invention. When asked what he wanted in return, he said, “Put one grain of rice on the first square of the board, two on the second, then double the number to four, eight and so on for each square until all 64 squares were covered.” The king accepted the offer until his treasurer or numbers guy pointed out that the 64th square would require more rice than had ever been grown! (In fact, the total number of grains of rice on the 64th square would equal 18,446,744,073,709,551,615 or in Big Number terms 18.4 Exa-grains — “a much higher number than most people intuitively expect.”)
Transistors, integrated circuits and the resulting computer revolution started in the early 1970s. These set the stage for development of GPS, the Internet and all other information and communication technologies (ICT). The right hand chart also shows that between 2020 and 2030 computing power will move to a point of inflection that is almost 90 degrees. To put it simply, this means that computing power will increase enormously.
The impact and implications of this quantum leap in ICT is hard to comprehend (remember the king). But your customers are already talking about and using “Big Data.” Some dealers understand what this means and how they can serve their customers.
What does the 2nd half of the chess board mean for your business? First, there is little time to prepare because it is here! We are now moving into the 2nd Half of the Chess Board.
Second, our business will change even faster and the rewards will be to those dealers who adapt best to the opportunities of the 2nd Machine Age.
Third, regarding how the 1st and 2nd Machine Age machines and businesses work together, we haven’t seen anything yet. If you like to work with new machines and technologies, the future will be a lot of fun!