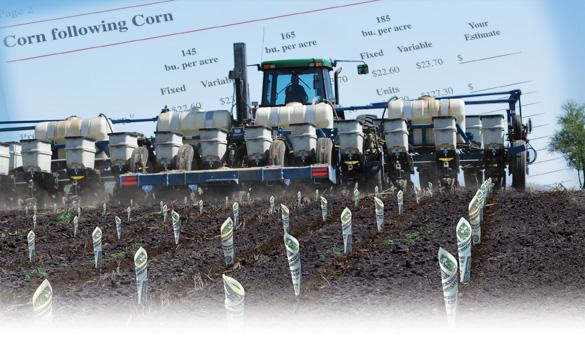
Selling Farm Machinery on a Per-Acre Basis Selling equipment based on machine efficiency and a cost-per-acre basis is the next step in creating a value proposition for farmers.
Michael Langemeier, Center for Commercial Agriculture
Purdue University, West Lafayette, Ind.
As farms continue to adopt technology that is labor saving and capital intensive, it has become increasingly important for the farm operator to evaluate machinery efficiency. These operators look to their equipment dealers to demonstrate how investing in new equipment will improve their cost per acre.
The continued increase in size of tractors, combines and other agricultural machinery has enabled farms to operate more acres and reduce labor use per acre. However, this increase in machinery size also makes it increasingly important to monitor machinery investment and cost per acre. Machinery investment often exceeds $500 per acre, while annual machinery cost per acre can average in excess of $100 per acre or 30% of total cost per acre on non-irrigated farms.
The most successful dealers will be those who are willing and able to fine tune their sales pitch and boil down the farmer’s machinery cost and investment on a per-acre basis.
Estimating Machinery Costs
Machinery costs can be divided into two primary categories: ownership costs and operating costs. Ownership costs are often referred to as overhead, indirect or fixed costs. These expenses do not vary with machine use intensity throughout the year. Operating expenses are often referred to as variable or direct costs because they vary with machine use during the year.
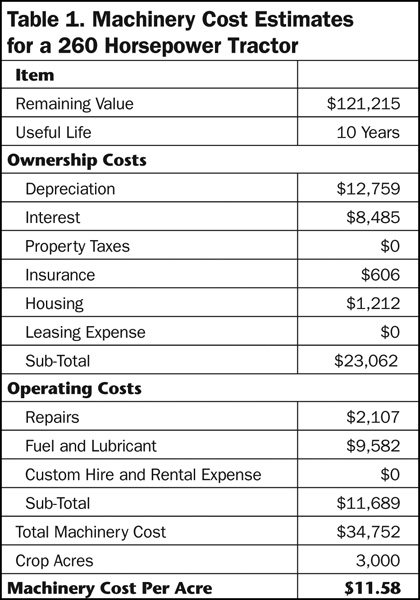
Table 1 illustrates ownership and operating costs for a tractor owned by one of the case farms that will be discussed in some detail below. This farm does not have livestock, so all of the relevant costs can be assigned to the crop enterprise. If a farm produces both livestock and crops, individual machinery costs need to be allocated between the crop and livestock enterprises.
Ownership Costs
Ownership costs include depreciation, interest, property taxes, insurance, housing and leasing costs.
Depreciation is a non-cash expense that represents the reduction in asset value resulting from age, wear and obsolescence. There are several methods that can be used to compute depreciation. Two common methods are the straight-line and declining balance methods. The idea is to mimic the actual decline in the machinery value over time.
If the straight-line method is used, depreciation is computed by subtracting salvage value from original cost and dividing the result by the asset’s useful life. Intensity of asset use and obsolescence should be taken into account when defining the useful life of an asset. IRS regulations compute depreciation and define the asset’s life for tax purposes. Tax depreciation is typically higher in the early years of the asset’s life and lower in the later years of the asset’s life. For benchmarking purposes, it is preferable to use a depreciation method and useful life other than those used for tax depreciation.
Depreciation is computed in Table 1 using the list price, salvage value (20% of original cost), and useful life of one of the tractors used by the second case farm discussed below. In this case, annual depreciation for the tractor is $12,759.
Interest is included as an ownership cost to reflect the fact that the money used for machinery investment has alternative uses. In other words, capital used for equipment investment has an opportunity cost. Interest is included as a cost regardless of whether the asset is purchased with debt, equity capital or a combination of both. Interest can be computed by multiplying the remaining value of an asset by a long-term interest rate. Alternatively, interest cost can be computed by adding salvage value to the original cost and dividing the result by two. This method uses the average value or the mid-life value in the computation.
In Table 1, interest cost is computed by multiplying the remaining value of the tractor by a long-term interest rate (7%). The annual interest cost for the tractor represented in Table 1 is $8,485.
Other ownership costs include property taxes, insurance, housing and leasing. Property taxes apply only to taxes related to machinery, which are common in some states. Leasing cost represents any annual lease payments for machinery. In the example in Table 1, the insurance and housing costs total $1,818 and are considered “other” annual ownership costs.
“Dealers need to show how investing in new equipment will improve cost per acre…”
Operating Costs
Operating costs include repairs, fuel and lubrication, and custom hire or rental expenses. Some estimates of operating costs also include labor. Annual repair costs vary with age, intensity of use and machine type. It is particularly important to note that repair costs increase over time or as the asset ages. This fact often leads to a tradeoff between higher ownership costs and lower repairs in the early life of the asset and lower ownership cost and higher repair costs later in the asset’s life. Annual repair costs for the tractor represented in Table 1 are $2,107.
Fuel and lubrication includes gasoline, diesel, oil and other lubricants. Annual fuel and lubricant costs for the tractor in Table 1 are $9,582.
Labor costs are sometimes included in machinery cost estimates and would include field time as well as time spent fueling and lubricating, repairing and transporting machinery.
Custom hire and rental expense should be included as a machinery operating cost. If a farmer receives custom hire income and the amount received is relatively small, this income can be subtracted from other machinery costs to arrive at total machinery costs. The subtraction reflects the fact that the costs associated with custom hire income would not have been incurred if the farm had not performed the custom operations. If custom hire income is relatively large, the farm should seriously consider analyzing the custom farm enterprise or activity as a profit center.
Summing the ownership and operating costs for the tractor represented in Table 1 yields an annual cost of $34,752. This farm has 3,000 acres of crops. Dividing the number of crop acres by the ownership and operating costs determines a machinery cost per acre for the tractor of $11.58.
Machinery Efficiency
Two commonly used benchmarks to evaluate the efficient use of machinery are machinery investment per acre and machinery cost per acre.
Other Resources on
Farm Machinery Benchmarks
For additional information on machinery benchmarks and benchmarks in general, the citations below may be helpful.
Edwards, W.M. “Estimating Machinery Costs,” Ag Decision Maker. PM-710, Iowa State Univ., November 2009.
Farm Financial Standards Council, Financial Guidelines for Agricultural Producers, 2008.
Kay, R.D., W.M. Edwards, and P.A. Duffy, Farm Management, Sixth Edition. Boston: McGraw-Hill, 2008.
Langemeier, M., “Measuring Economies of Size with Expense Ratios.” Journal of the American Society of Farm Managers and Rural Appraisers. 76(2013): 222-235.
Lazarus, W.F., “Machinery Cost Estimates.” Univ. of Minnesota, May 2012.
Machinery investment per acre is computed by dividing total machinery investment (such as investment in tractors, combines and other machinery) by crop acres or harvested acres. In regions where double-cropping is prevalent, using harvested acres gives a more accurate depiction of machinery investment. Machinery investment per acre typically declines with farm size. It is important to compare machinery investment per acre with similarly sized farms and to examine the trend in this benchmark to evaluate machinery use efficiency.
A farm with a relatively high machinery investment per acre needs to determine whether this high value is a problem. If the farm faces serious labor or timeliness constraints, this benchmark may be relatively high. However, if this benchmark is high due to the purchase of assets used to mitigate income tax obligations, the farm needs to think about whether this is a profitable long-term strategy as the farm may exhibit high costs per acre due to this strategy.
Summing depreciation, interest, property taxes, insurance, housing, leasing, repairs, fuel and lubricants, and custom hire and rental expense, and dividing the resulting figure by crop acres or harvested acres produces the machinery cost per acre. Again, in regions where double-cropping predominates, using harvested acres is preferable.
Case Farm Examples
Case Farm 1. Machinery investment and cost for the first case farm is presented in Table 2. This case farm has 600 acres of corn, 600 acres of soybeans, 150 acres of alfalfa, 150 acres of corn silage and 150 dairy cows. The investment and cost presented in Table 1 represent the relevant amounts for the crops. In other words, the investment and cost of machinery used for the livestock operation are excluded from the totals in Table 2. Machinery investment per acre for this farm is $385.73.
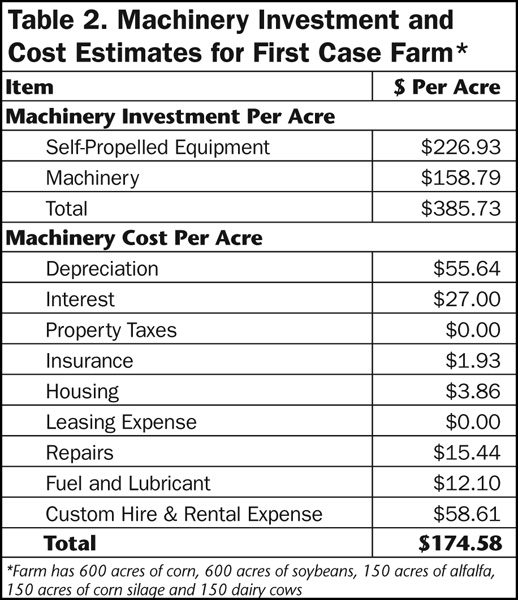
Machinery costs include depreciation, interest, insurance, housing, repairs, fuel and lubricant, and custom hire expense. The custom hire expense includes operations related to fertilizer applications, hauling and spreading manure, harvesting corn silage and aerial herbicide application. Machinery cost per acre for this case farm is $174.58.
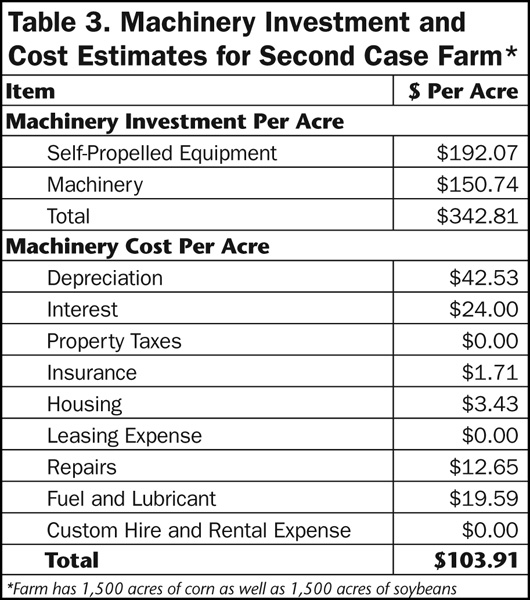
Case Farm 2. Crop machinery investment and cost for a second case farm is presented in Table 3. This case farm has 1,500 acres of corn as well as 1,500 acres of soybeans.
Machinery investment per acre is $342.81 for the second case farm. Unlike the first case farm, this farm does not custom hire any of the tillage operations. Machinery costs include depreciation, interest, insurance, housing, repairs and fuel and lubricant. Machinery cost per acre for this case farm is $103.91.
Machinery Benchmarks. Unfortunately, machinery benchmarks are not commonly available. However, some information is available from the farm management programs in Kansas and Illinois. Crop machinery investment and cost for non-irrigated crop farms and crop/dairy farms participating in the Kansas Farm Management Assn. program were $229 and $84 for the non-irrigated farms and $230 and $101 for the crop/dairy farms in 2012 (www.agmanager.info/kfma).
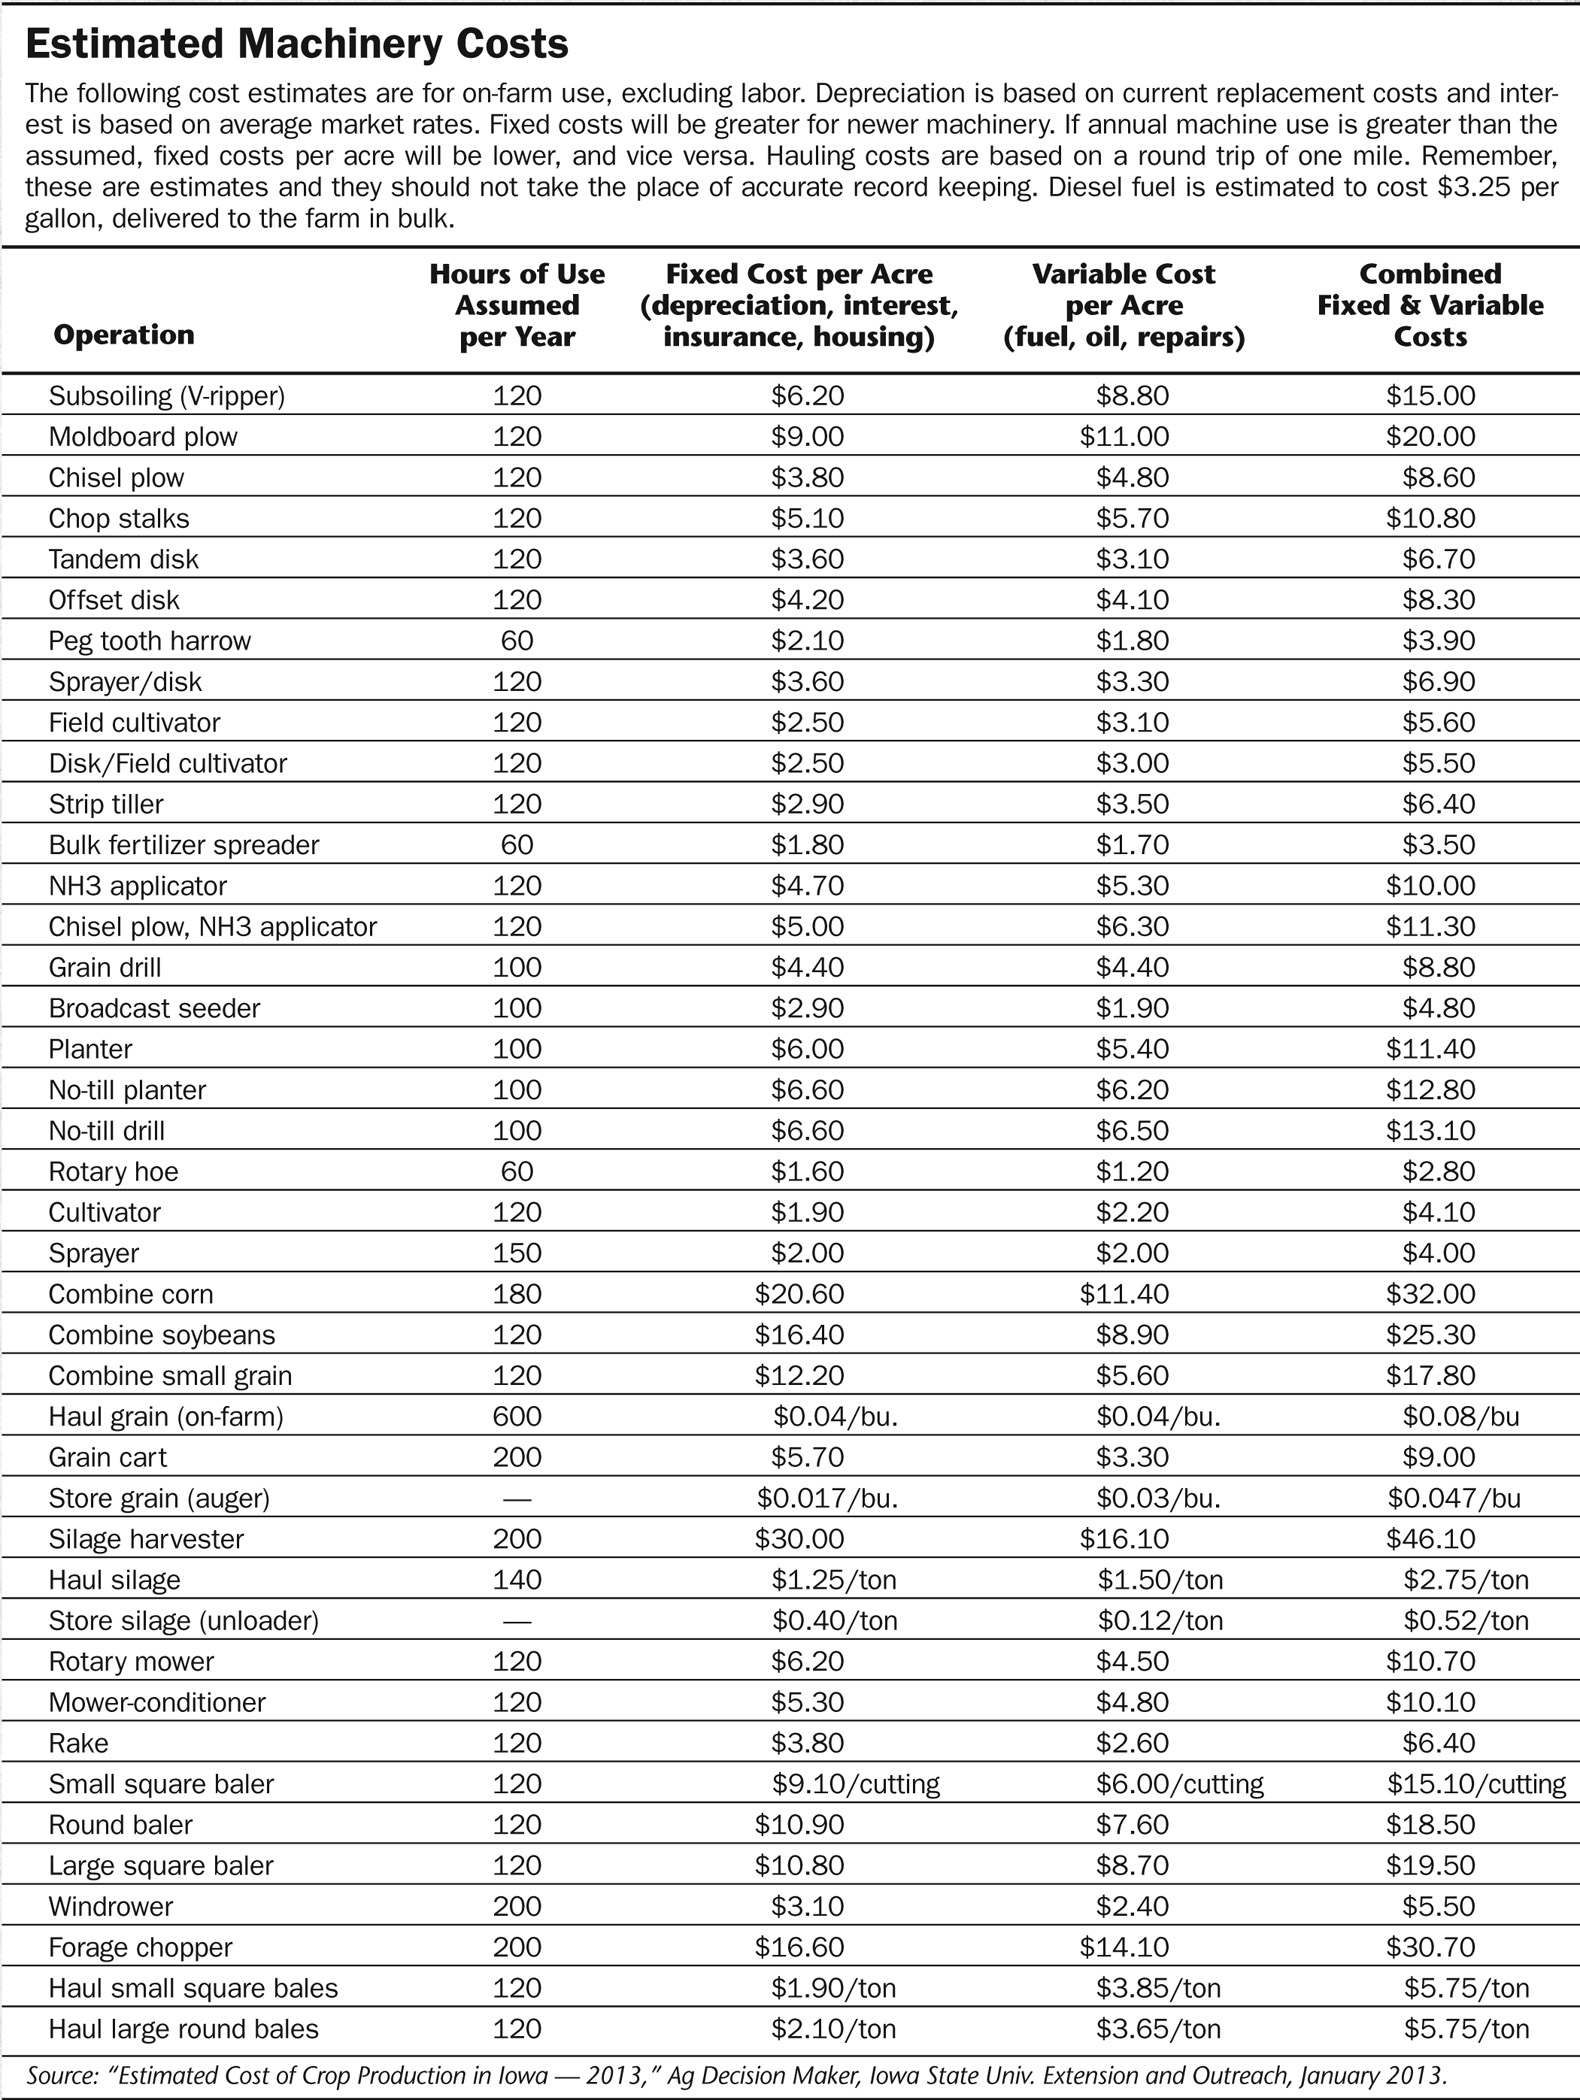
The amounts for both case farms discussed above are certainly above these figures. However, Brad Zwilling, Jim Locher and Dwight Raab in a June 22, 2012 farmdoc daily article (www.farmdoc.illinois.edu) illustrate machinery value per acre for farms with 250-5,000 acres. In their graph, a farm with 1,500 acres would have a machinery investment per acre of approximately $425, while a farm with 3,000 acres would have a machinery investment per acre of approximately $375. The crop machinery investments per acre for both of the case farms are below these amounts. (Please see “Estimated Machinery Costs” for additional data from Iowa State Univ. Extention service for a wide range of farm implements.)
The discussion above focused on machinery benchmark comparisons among farms. It is just as important to track the trend in the machinery benchmarks over time on the same farm. Increases in machinery investment and cost are often related to decreases in financial efficiency (i.e., lower asset turnover ratio and higher depreciation expense ratio).
Machinery Investment & Cost
There are several factors that impact machinery investment and cost per acre. One of these factors is machinery selection. Field capacity, availability of labor, tillage practices, crop mix and timeliness constraints are all important considerations when selecting machinery. Purchasing larger machinery ensures operations are completed in a more timely manner, but also can lead to higher machinery investment and cost per acre unless the farms expands by renting or buying additional land.
A second factor impacting machinery investment and cost relates to the alternatives available for acquiring machinery. Alternatives include ownership, rental, leasing and custom hire. To increase control over use and timeliness of machine use, most farms prefer to own machinery. If ownership is the preferred option, a farm needs to carefully monitor machinery investment and cost. Factors that can lead to reductions in investment and cost include the following: using smaller machinery, increasing annual machine use; holding onto machinery longer before trading; purchasing used machinery;
using alternatives to ownership such as custom hire; farming more intensely, for example utilizing double-cropping.
Of course, many of these factors may decrease timeliness, which could be particularly detrimental during planting and harvesting seasons. Thus, as with most machinery issues a balance between controlling machinery investment and cost, and timeliness needs to be reached.
For machines that are used infrequently, it is important to compare ownership costs to custom hire charges. Of course, availability and timeliness concerns are pertinent to the choice between these two options. As indicated above, machinery ownership costs typically decline as acres and production increases. Custom hire rates, on the other hand, typically exhibit a fixed rate per acre.
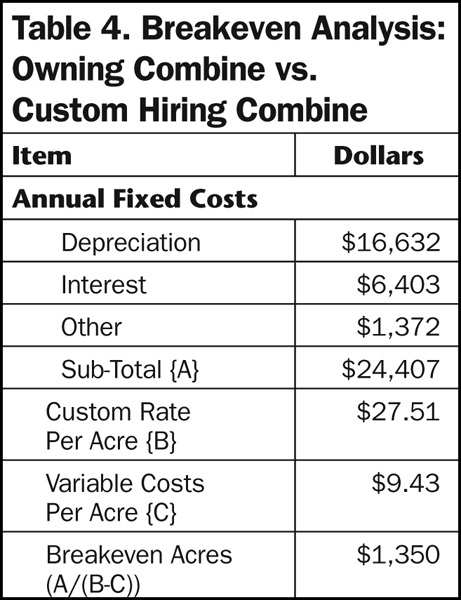
When data is available, a breakeven point where the decision switches between custom hiring an operation and owning a machine can be derived. Table 4 contains the relevant data for the second case farm. The breakeven acres for this farm are 1,350. If this farm had less than 1,350 acres, it would be less costly to custom-hire the harvesting operations. Since this farm has 3,000 acres, it makes sense for the farm to own a combine.
A third factor that impacts machinery investment and cost is replacement decisions. Many farms follow one or a mixture of the following strategies: keep and repair, trade often, trade when income is high, or invest each year.
The “keep and repair” strategy is often used by farms that have one or more individuals that are mechanically inclined. Farms with severe timeliness constraints usually use the “trade often” strategy. For example, if a large farm produces primarily corn, most of their crop needs to be planted and harvested in a narrow window. This farm may choose to trade often so machines are not down during the critical periods.
Many farms trade when income is high. When income is high, the farm has the cash flow to purchase machinery. Moreover, this strategy may be related to a farm’s tax management strategy. Finally, some farms invest in machinery in most years. This strategy spreads out the cash flow requirements as well as the loan payments.


