
If this pre-harvest grain rally holds through the rest of 2026, what happens to row-crop tractor sales?
It's a fair question with not an entirely satisfying answer. First, let’s be clear. All commodities matter, but corn is representative of the current commodity market swing and has better historic correlation with equipment values, so for simplicity’s sake, let’s run with it. Yet even just when focusing on one commodity, it is a bit more complicated, and honestly we found out it doesn't matter as much as the supply sitting on your lot right now.
The trouble comes when you try to use commodity values alone to predict in a vacuum. That’s where a look into the underlying dynamics of supply and velocity from a reliable source can be the insight you are looking for.
Supply is the Bigger Lever
Here's what happened to used row-crop tractors between early 2023 and today. In this particular study I am just using John Deere and Case IH sales between 175 and 424 horsepower across just the U.S.
Units sold per month climbed through 2023. Then 2024 arrived, sales turned down, yet used inventory kept building anyway. Backlogged OEM production continued to pour into the channel while retail demand fell out from under it. Supply peaked in Q4 of 2024.
Monthly sell-through for row-crop tractors has roughly halved since early 2023, from 20.9% down to 10.8% this year. That decline has been steady, with the sharpest drop in 2024.
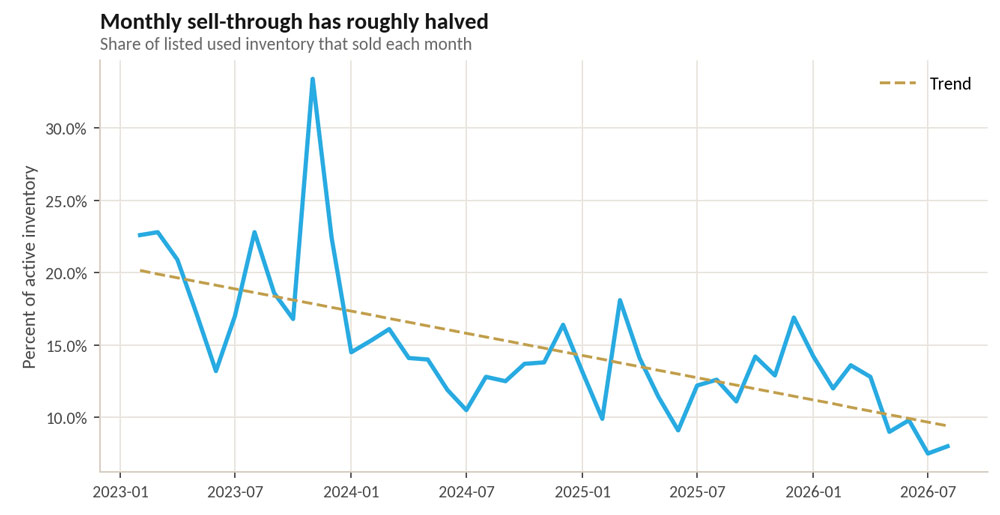
FIGURE 1: Monthly Sell-through. Tractor Zoom Pro
Dealers have since worked off about 30% of listed supply. This has been a reactionary game of catch-up as demand fell further and faster than supply did. Months-of-supply peaked in early August before a strong category sales month recently turned the tide.
That's the setup a grain rally would be arriving into. It also means a starving market is building underneath, with tractor replacement demand growing every month that new sales continue to lag.
What the Auction Market Says & Why You Should Care
Auction values do trend with corn. You can see it going back to 2010 in an auction value index that adjusts for age, hours and specification.
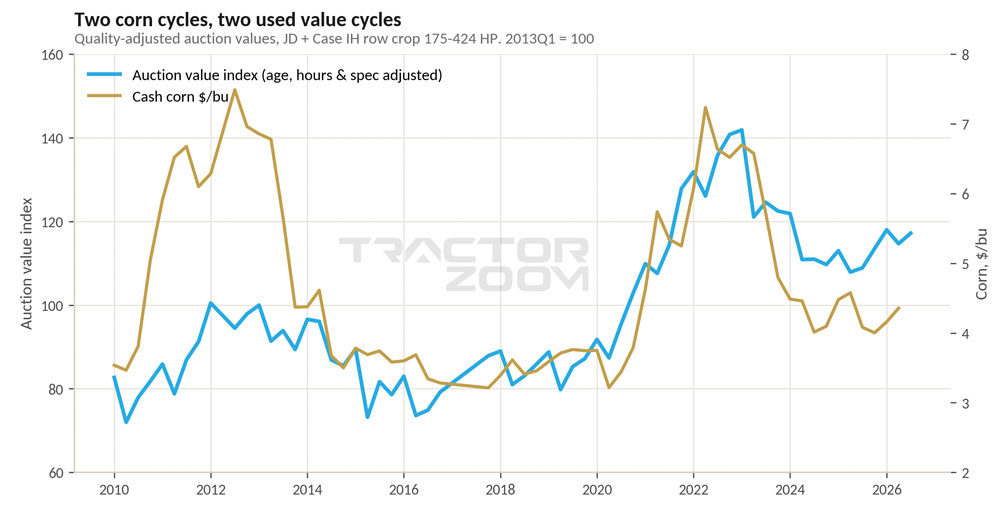
FIGURE 2: Auction value index vs cash corn, 2010-2026. Tractor Zoom Pro
The reason auction data carries weight here is that an auction price is clean. No dealer cost sits inside it, no trade allowance, no floorplan decision. It's what the market will pay, and as your experience will tell you, those high years for auction values were good retail sales years as well.
A variable that is hidden here is available supply. When supply was incredibly tight, the auction price was very responsive to corn value (2021-23). Auction values still rose from 2011 to 2013, but less so since used tractor supply wasn’t as tight. That distinction is important to remember as we come into potentially a third wave where supply is tighter than in 2011, but not as short as 2022.
What goes up, must come down. But how far and for how long? Our auction index fell almost 20% from the first quarter of 2023 to the second quarter of 2026. Now put this correction next to the last one.
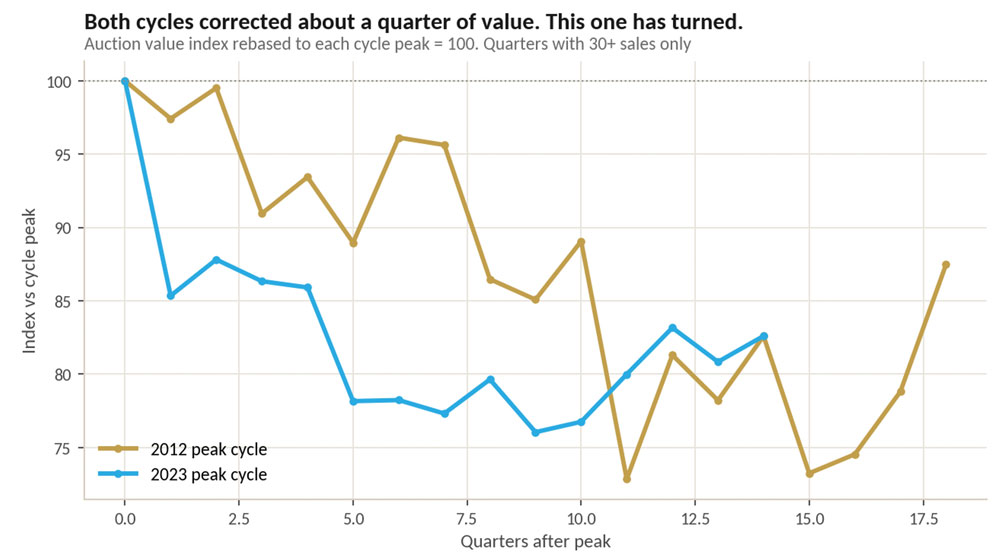
FIGURE 3: Both cycles rebased to their own peak. Tractor Zoom Pro
The 2012 cycle gave back about 27% of value. This more recent one gave back about 24% and bottomed in the second quarter of 2025, 9 quarters after it peaked. It has since recovered to about 83% of peak. Roughly 9% of that recovery came before the corn rally started, which tells you the used market had already turned for its own reasons. (cough … lower supply and replacement demand).
It should be noted that dealer retail transaction prices went the other direction in this recent correction, rising about 5% in the 175-299 horsepower class and about 10% in the 300-424 class from 2023 to 2026. The gap between auction and retail widened from roughly 17% to roughly 34%, which piles on as one more cost to carry for a farming operation already watching its inputs. Again … we don’t operate in a vacuum.
Tracking Days on Lot
Auction is one thing, but the prevailing trend now is to sell through retail if at all possible. A solid report to benchmark your used department on is days-on-lot (DoL). Through Tractor Zoom historic analysis, DoL correlates tightly with margin at (-0.79) on quarterly medians, so it tells you 80% of what a margin report would, and it updates faster.
DoL has gone from roughly 70-85 days in late 2022 and early 2023 to about 285 days now. It's the same story in both horsepower classes. Where it gets interesting is by hours.
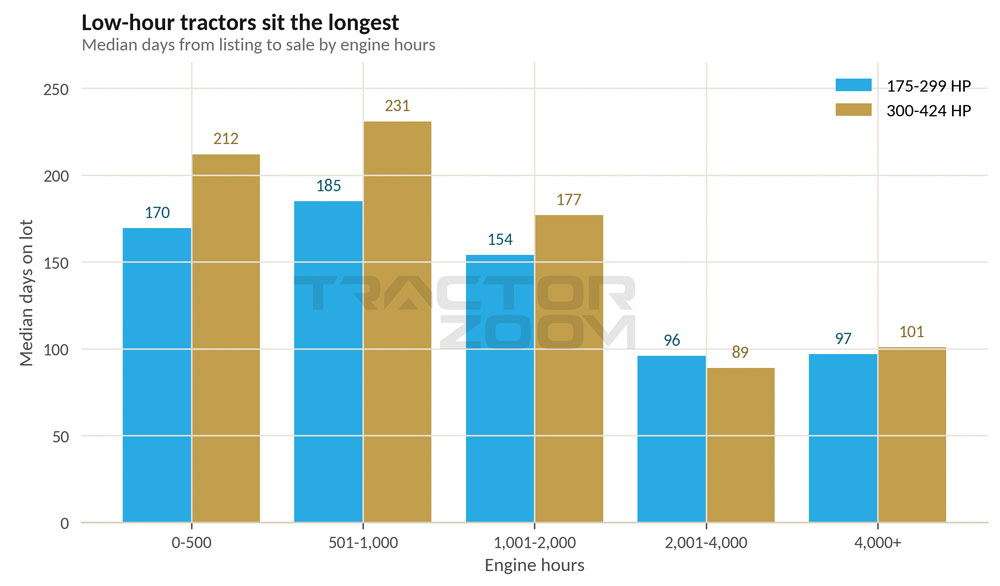
FIGURE 4: Median days on lot by engine hours. Tractor Zoom Pro
Low-hour tractors sit the longest. The worst band isn't the newest iron, it's the nearby 501-1,000 hour range, which runs 185 days in the smaller class and 231 in the larger one. Everything past 2,000 hours clears in roughly 90-100 days regardless of class. Data would suggest there is potential here to recoup margin lost on the slower, newer iron. Those low-hour units also carry the highest price tags, so they tie up a disproportionate amount of capital, and for twice as long.
For the higher horsepower tractors, the slowest thing on the lot is a $300,000 – $400,000 range. The stress sits in the middle to higher-value used range.
Coming Back to Corn
Keeping with the Days on Lot metric, let’s look at that compared to cash corn.
Four quarters in the previous 15 had cash corn above $5.20. Three of them were the fastest selling quarters for tractors that we've measured, and the fourth ranked about seventh out of 15. Everything below $4.60 is a jumbled, slower mess.
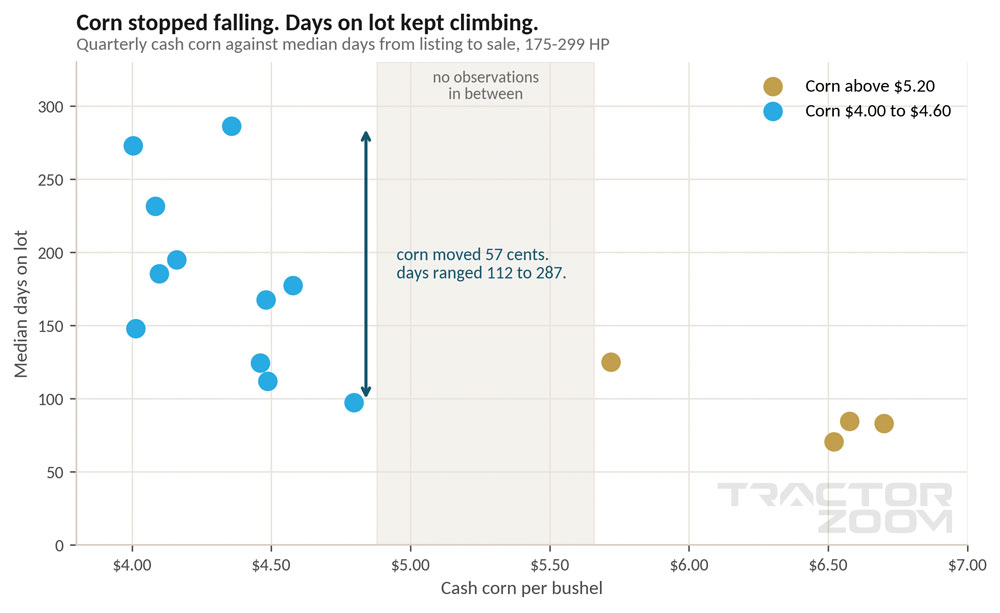
FIGURE 5: Cash corn vs median days on lot. Tractor Zoom Pro
There are reasons why corn, or any commodity, won’t be an easy direct correlation with sales success. Farmer's break-even moves with input costs, which shift the profitability threshold around. My farm’s number is closer to $5.40 today given where inputs sit. The more established farmer down the road likely has a sub-$5 break-even point.
Call it a pattern worth watching rather than a rule. Cash corn has been running near $5.00 nationally, with the nearby board touching a 3-year high of $5.21 on Sept. 1 and December futures trading up near $5.48.
Showdown in December
Regardless of market rallies, December runs about double a normal month in sales volume for 175-300 horsepower tractors, and 70% above normal for the larger tractors.
So expect a run-up in December if corn continues to clear break-even. That will not be everywhere. USDA's September yield estimate came in at 178.5 bushels against last year's 186.5, and the national picture is uneven. Iowa and Illinois look strongest among the large states. North Dakota carries a 93% probability of finishing below its own trend, South Dakota 80%, North Carolina effectively 100%. Missouri, Tennessee and Pennsylvania are running above theirs. Record high diesel prices may also tip buyers towards newer, more fuel efficient options.
All of this sits against new tractor retail sales down 38% over 2 years and a Creighton Farm Equipment Sales Index of 22.2 in August, the 36th straight month below growth-neutral. Equipment borrowing is accounting for just 5.3% of ag lending. If replacement purchases come, they'll more likely come out of excess cash rather than credit with tax benefits, which makes this year's regional profitability the variable that likely will matter most.
One last data point. August sales velocity moved significantly faster than the prior month and the same month last year. Some of that speed came at the expense of margin. It also cleared inventory, which leaves supply tighter heading into the final selling months of 2026. If your dealership is right-sized on inventory and commodities continue their run-up to the end of the year (and beyond?), are you fully ready to eval, quote, trade and invoice? Now is the time to understand the available supply on your lots and in your area, reprice to set your margin targets, canvas your sales area and execute your plan.
Tighter supply, a deprived replacement cycle, cash in the checkbook and a December tax window. That combination has produced run-ups before and likely will again.
Trade Values & Trends is brought to you by Tractor Zoom.

Tractor Zoom transforms and connects big data into real-time actionable insights, accelerating a dealership’s heavy machinery and farm equipment business. Our solution, the only one providing transparent, comparable sales data, connects multiple data systems into one easy to use CRM and equipment valuation platform, empowering dealers to optimize decisions, maximize inventory turns, and increase your team’s efficiency and effectiveness. Spend less time on unproductive tasks and more time growing your customer base as we revolutionize the way you drive profitable decisions in the equipment industry.
Andy Campbell is the Director of Insights at Tractor Zoom, where he helps equipment dealerships turn data into faster decisions, better alignment, and stronger margins. Raised on a multi-generation Iowa farm, Andy blends deep ag roots with experience in Fortune 500 companies, tech startups, academia, and as a consultant to make sense of what’s really driving the farm equipment market.