
Basildon, UK — CNH Industrial N.V. (NYSE: CNH) reported Net income for the three months ended June 30, 2026, of $141 million, with basic earnings per share and diluted earnings per share of $0.11, compared with Net income of $217 million and basic earnings per share and diluted earnings per share of $0.17 in Q2 2025. Adjusted Net income(1) for the second quarter of 2026 was $161 million compared to $216 million for the second quarter of 2025.
Consolidated revenues for the second quarter ended June 30, 2026, were $4.80 billion, and Net Sales of Industrial Activities were $4.14 billion, both up compared to Q2 2025.
Net cash provided by operating activities was $145 million, and Free cash flow of Industrial Activities was $150 million in Q2 2026.
Income tax expense was $43 million ($76 million in Q2 2025) with an effective tax rate (“ETR”) of 25.0% (27.6% in Q2 2025). The adjusted ETR(1) was 25.1% for the second quarter (27.7% in Q2 2025).
“Our second quarter results reflect disciplined execution by the CNH team in a market that remains at the trough of the agriculture cycle,” said Gerrit Marx, Chief Executive Officer of CNH. “Despite the industry conditions, we delivered year-over-year revenue growth and continued progress on our strategic priorities, including quality, sourcing, operational efficiency, and dealer network consolidation. While farmer economics remain pressured, we are seeing constructive equipment-cycle indicators, including dealer inventory normalization, aging fleets, and a more balanced relationship between new and used equipment pricing. We remain focused on supporting our dealers and customers today while investing in the iron and technology capabilities that will strengthen CNH through the next cycle.”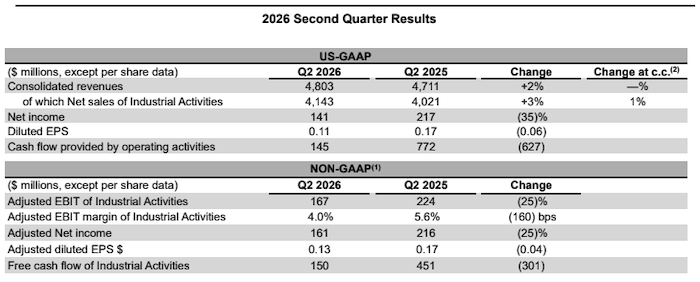

In North America, second quarter industry sales volume was down 16% year-over-year for tractors under 140 HP and down 17% for tractors over 140 HP; combines were down 7%. In Europe, Middle East and Africa ("EMEA"), tractor and combine demand down 11% and 1%, respectively. South America saw tractor and combine demand decline 8% and 29%, respectively. In Asia Pacific, tractor demand increased 15%, while combine demand decreased 48%.
Agriculture Net sales were flat year-over-year in the quarter at $3.3 billion, a result of favorable price realization, offset by lower volumes in South America.
Adjusted EBIT decreased to $170 million from $263 million in Q2 2025, primarily due to lower volumes in South America, unfavorable mix in North America and EMEA, the impact of tariffs, higher Selling, general and administrative expenses (“SG&A”) and Research and development expenses (“R&D”) and lower joint venture results. SG&A expenses were mainly impacted by higher labor costs. R&D expenses represented 6.1% of sales in Q2 2026 (6.0% in Q2 2025).
Global industry sales volume for construction equipment increased 17% year-over-year in the second quarter for Heavy equipment and 6% for Light equipment. Aggregated demand increased 5% in North America, 9% in EMEA, 12% in South America, and 16% in Asia Pacific.
Construction Net sales increased 12% in the quarter to $866 million, driven by higher volumes in North America and included shipments that were initially delayed during the first quarter of 2026.
Adjusted EBIT decreased to $15 million from $35 million in Q2 2025, primarily due to the impact of tariffs and higher R&D expenses, partially offset by higher volumes and lower SG&A expenses. SG&A benefited from the absence of prior year non-recurring costs, partially offset by higher labor costs.
Financial Services revenues decreased 4% in the quarter, largely driven by unfavorable volumes in South America and North America, reduced used equipment sales due to fewer operating lease maturities, and lower yields in all regions except South America, partially offset by favorable currency translation.
Net income was $71 million in the quarter, a decrease of $16 million versus Q2 2025, largely driven by margin compression in all regions except North America, lower volumes in South America and North America, higher risk costs in Brazil, and increased labor costs, partially offset by a lower effective tax rate.
The managed portfolio (including unconsolidated joint ventures) was $28.0 billion as of June 30, 2026 (of which retail was 70% and wholesale was 30%), down $0.7 billion compared to June 30, 2025 (down $0.7 billion on a constant currency basis(2)).
As of June 30, 2026, the receivable balance greater than 30 days past due, as a percentage of receivables, was 4.4% (3.9% as of June 30, 2025), due to economic factors impacting farmers, specifically in South America.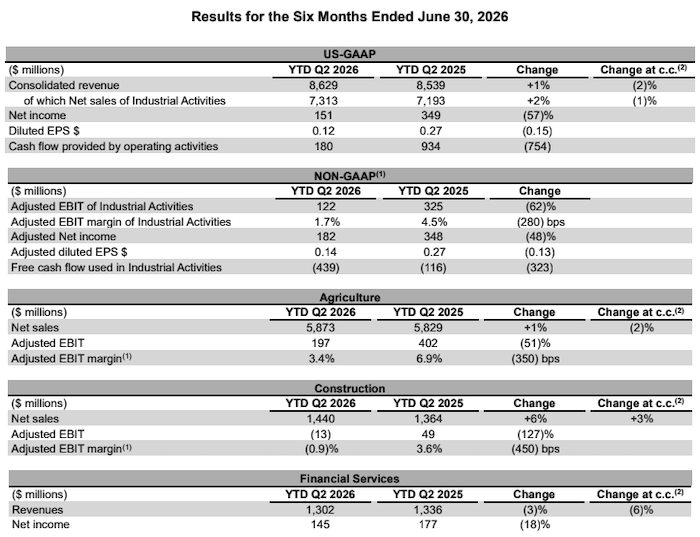
2026 Outlook
Farmers continue to face challenging market dynamics, including low commodity prices, high input costs, and an uncertain trade environment. CNH’s Agriculture segment has and will continue to respond to these market dynamics by maintaining low production levels, working with its dealer network to lower channel inventory, pursuing cost efficiencies, and managing rapid changes in trade policies. CNH’s Construction segment will continue to focus on quality, manufacturing efficiencies, and tariff cost offset opportunities.
CNH is benefitting from recent changes in tariff levels yet also incurring higher transportation costs and managing challenging market conditions in South America. In this trough year of the agriculture industry cycle, CNH is focusing on its sales execution, cost discipline, and manufacturing performance. We forecast that we will deliver results at the higher end of the forecast ranges previously communicated.
Consequently, we are updating our 2026 outlook as follows:
- Agriculture segment net sales about flat year-over-year, including +2% currency translation effects
- Agriculture segment adjusted EBIT margin between 5.0% and 5.5%
- Construction segment net sales up between 5% to 10% year-over-year, including +2% currency translation effects
- Construction segment adjusted EBIT margin between 1.8% and 2.3%
- Free Cash Flow of Industrial Activities(3) between $200 million and $400 million
- Adjusted diluted EPS(3) between $0.41 to $0.46