If you asked your customers their equipment cost per acre, would they have an answer for you? Some might have a general idea of what their principal and interest payments are annually and could arrive at a per acre cost. But would that include key factors like depreciation, inflation and appreciation in equipment costs over the lifetime of the equipment fleet? Most likely, no.
Why should equipment dealers care about their customer equipment costs -- isn’t that personal? Not really. Professional farm businesses will require more and more service, value and insight from equipment dealers in the coming decades, and you should be in a position to provide value and consultation in one of their largest line-item expense operations.
We often say, “Equipment is the second largest line-item expense, and usually the most misunderstood.” What an opportunity for you to help the farmer better understand their costs, trade plans, and rates to the other farms they’re collaborating with.
University Rates
You might be thinking, ”Why would I go through all of this work when there are already numbers published by universities on equipment rates and suggested values?"
Here are 3 reasons:
- I have never received a university custom rate survey to fill out. Who are the operations that are submitting these rates? Do they truly know their costs?
- Do the operations reporting to the university have the same size of farm, value of equipment and trade plan as the farmers you’re working with? Probably not.
- Location, terrain and efficiency and speed of operations has a huge impact on the rate. If Farmer A likes to combine at 3.2 mph, and Farmer B is hammer-down at 5.7 mph. Does their equipment wear, turn hours and run as effectively as the other? The answer is “no.”
If you’re an academic, please don’t throw the book at me! There is a ton of great information published by universities on fuel usage, tractor efficiencies and key considerations in business decision-making. However, I think it can all be a bit “academic” for farm operations evaluating their farm costs. They need to know key data points and have an actionable plan moving forward for equipment management.
Variables Needed to Calculate Equipment Rates
|
True Market Value |
Fuel Efficiency |
Width of Implement |
|
Tractor % Use |
Fuel Cost |
Acres per Day |
|
Insurance Cost/Thousand |
Labor Cost |
Desired Margin |
|
Tech. Subscription Cost |
Acres for Each Pass |
Trade Plan/Schedule |
- True Market Value – Appraised value of what that machine or implement is worth. If your customer drove it onto your lot and dropped the keys on your desk or unhooked the implement, what is the value of the piece?
- Tractor % Use – If one 300 hp tractor does 4 separate operations, attribute a % use to each operation. Note: the totals MUST equal 100%.
- Insurance Cost/Thousand – This is a simple variable derived from True Market Value/Insurance Policy Cost to ensure the equipment.
- Tech Subscription Cost – RTK/X, Climate, Ag Leader, etc.
- Fuel Efficiency – Measured in gallons per hour in normal operating conditions and environments. Most people have a good pulse on this, but they may rely on you to provide this information.
- Fuel Cost – Booked for the coming growing season or today’s price.
- Labor Cost – Hourly Rate. If they give you “I’m not worth anything I’m just a farmer” just put in $30/hour.
- Acres for Each Pass – How many acres will this operation consist of in an average year, and average number of acres in the years ahead?
- Width of Implement – Average width if two or more machines/pass. Example: 40-foot bean head, 30-foot corn head = 35 feet for harvest pass.
- Acres per Day – Acres that are managed in a “normal” day. You will use “Hour/Day” for calculating efficiencies. This just helps the efficiency factor arrive at the correct number of acres.
- Desired Margin – We will talk more on Return to Assets. As a preview, if you stuck $1M in the stock market you would expect a Return on Investment, correct? Equipment should be treated the same way. Typical is 8-12%, which ends up being around 5% at the end of the year.
- Trade Plan/Schedule – How long is the farm operation planning to run the equipment? This is the perhaps the most important part of the whole process, and the biggest differentiator from university rates. We are looking to tie the whole equipment strategy process together.
Harvest Example
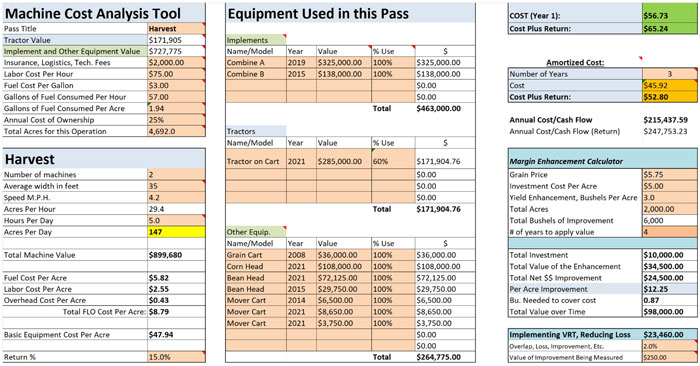
In this example, the farmer is running 2 combines over 4,700 acres. One is fairly new, the other with 7 seasons under its belt. The tractor that lives on the grain cart spends 60% of its time on the grain cart, and the other 40% on the strip-till bar in the next example.
This farm runs one combine in corn, and both in beans, something we commonly see in the Midwest due to logistics, unloading capacity and timeliness of soybean harvest. We also include capital assets that are involved in harvest such as the grain cart and mover carts, because harvest doesn’t occur without them. We leave the semi and grain-hauling vehicles separate to evaluate that cost differently.
The farm’s labor is $25/hour; two in the combine and one in the grain cart. Both machines burn about 25 gal./hr. in the combine, and 7 in the grain cart. We average the width of the heads for a singular harvest pass to reduce confusion between corn and soybeans. We always get the question, “Shouldn’t corn and soybeans be different?” Historically, the pass has only been about $1/acre difference. With two machines, if one goes down you still need to run the other one, and same for corn. The big picture idea is allocating the associated capital to a per-pass basis and including the depreciation, inflation, and cost appreciation factors. It also makes it much easier to understand one singular harvest cost/acre.
With $900,000 of capital tied up in the pass, it can seem daunting. The fuel, labor and overhead costs come out to about $8.79/acre, and basic equipment costs are dialed in at $47.94. Assuming a 15% return, this would be a Year 1 cost of $65.24/acre. This means you would need to allocate $65.24/acre to upgrade that equipment on an annual basis and build that dollar amount into your cost of production. However, most operations aren’t changing their fleet annually.
This leads us to a rate adjustment through amortization. We amortize the rate over the number of years due to depreciation total dollars tapering off over time. We use the same constant cost of ownership, but naturally there are less dollars of “realized” depreciation, inflation, and cost appreciation over time. This leaves us with a final rate of $52.80/acre, which is very efficient. For perspective, most operations run in the $55-68/acre or much more. Some people just like to own nice, newer combines and run it over fewer acres. If they’re in a position to do that, good for them.
What Does This Rate Really Mean?
The $52.80/acre for the next 3 years will generate $247,000 of cash flow annually, or roughly $750,000 over 3 years. Out of this “income” from the equipment, farms should pay labor, fuel and oil, maintenance and repairs, principal and interest payments, leases, subscriptions, insurance, etc. Everything associated with this pass should be paid out of this rate.
What happens with the ‘Left-Over’ Dollars?
Remember that depreciation, inflation, and cost appreciation we discussed? Well, you don’t write a check for that every year, but you’re going to when you replace the equipment. The same type of machine is going to cost more 3 years from now, depreciation will have dramatic decreased the value, and other money inflation may have occurred. Suddenly that $900,000 of equipment might now cost $1.05 million. And if you haven’t been charging the according rate, building that rate into your cost of production, and marketing with your equipment cost considered, you’re going to be behind the 8-ball.
“Left-Over” dollars can be used in 3 ways:
- Used to purchase new machinery or upgrade.
- Left in the equipment company or “bucket” as working capital.
- Paid back to the owner as a dividend (be careful here -- what do you do when you have money? Spend it.).
This improved dollar management is the whole purpose behind setting rates, understanding true costs and marketing with your equipment dialed in on a cost/bushel to make better decisions
Strip Till Example
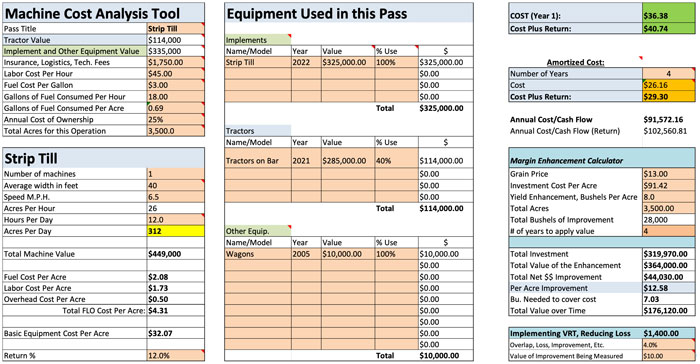
Here a customer is interested in buying a new strip-till unit and a new-used tractor for the bar. He thinks he can justify the cost if he picks up 6-8 bushels on soybeans, and after running the margin enhancement calculator he is interested in pursuing the piece of equipment and seeing where the rate would be.
The bar, 40% of tractor expense (other 60% used on conventional tillage in the Spring), and a couple of wagons has a total machinery value at $450,000. The customer can use their current guidance subscription, and with 18 gal./acre at $3/gal., the fuel, labor, and overhead (FLO) is pretty low. The basic equipment cost/acre is higher than he’d like, but he thinks he can easily get across 3,500 acres and some custom work between Fall and Spring applications. Running the machine for 4 years provides a good margin return and keeps the rate at $29.30/acre. We see this range from $16-40/acre, which is another reason to run the scenarios for specific farm situations.
I will caution that strip till units tend to have higher maintenance cost from wear parts, so we tend to set the Return Rate closer to 12-15% for the “catch all” expenses that can sometimes get tied up in the unit. Another piece of perspective is doing additional custom work can quickly help with costs in these units.
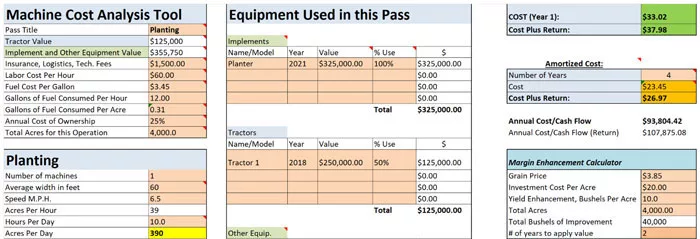
Planter Example
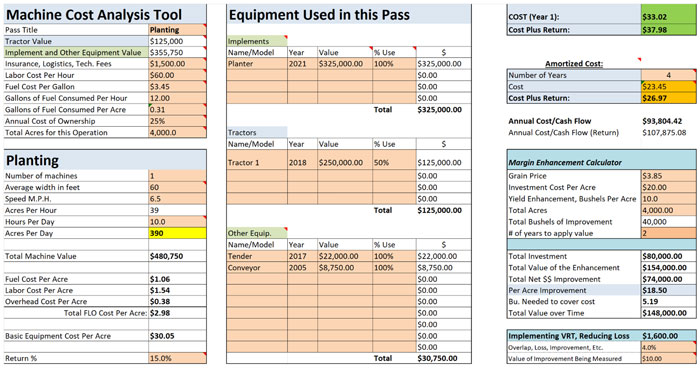
Now that you know the process, I won’t walk through this example in as much depth as the other two. What I will mention here, though, and in the final sprayer example below, is the planter and sprayer are two of the “easiest” expenses to justify from an improved yield, timeliness of application, ability to rip through acres and constant improvement in technology in both systems.
It is common for high speed 24-row planters to get 400-700 acres planted in a day, depending on conditions, refill and field size. This makes for timely planting conditions (in theory), good emergence and better management. Likewise, the sprayer can cover 500-1000 acres/day if conditions are fit (and legal).
Sprayer Example
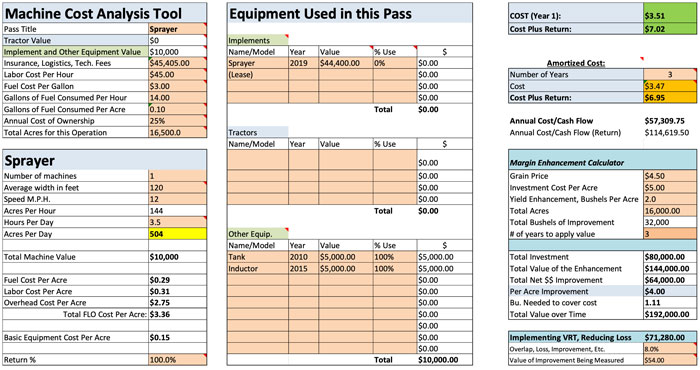
Three things to point out with this sprayer example:
- This is a lease. The leased dollars are put in with Insurance, logistics and technology fees so the cost is applied to every acre on an annual basis, and not amortized. It’s a function that allows us to not factor in depreciation and the other variables because they don’t apply.
- I input that correctly – a 100% margin. $7-11/acre is a common range for spray application. In Year 1, over 16,500 acres (6,000-acre operation, 2.5X for corn (2) and beans (3)) the cost is $3.50/acre, everything considered. There is good margin in some areas, and as I mentioned, it is one of the easiest expenses to justify for timely application, if you can afford to keep someone in the seat.
- Notice the Variable Rate/Rate Control/Shutoff tool in the bottom right. If we can reduce overlap by 8%, with $54/acre worth of herbicide, fungicide, and insecticide, we can save $70,000 year in product. This is huge, and quickly makes the $40-100,000 investment in individual row shutoffs make sense, especially in timeliness of application on top of that.
One note to consider before we wrap up -- old vs. newer equipment line ups. Old equipment with lower value makes the rates seem lower. Operators are often one engine failure, transmission issue or major repair away from negating any cost savings they’ve had in running that machine an extra 3 years because they think they’re saving money. Also, as I show in my final example here, you can account for trade in values with clients and projected cost with new machines. Two scenarios are common here:
- Wanting to get the rate set up right when you get started. If a farm knows they’re going to be making an upgrade soon, they should account for that cost in initial rates for the next 3-7 years. Example: upgrading tractors that we know from the 3–5-year equipment plan is going to cost $100,000 to upgrade in the planter pass above. We add in the new amount and percent % as a “trade” so we can get the appropriate rate from the start.
- Simply evaluating what a trade option would do to the rate. This is common when a farm operation takes on more acres and needs to size appropriately. Running their acres, new machinery cost and outlook will help them see (oftentimes) that their rate really won’t increase, and they could potentially be a heck of a lot more efficient and spend less time behind the seat. These upgrades become necessary over time as a farm grows, and you can help them by being a part of the solution.
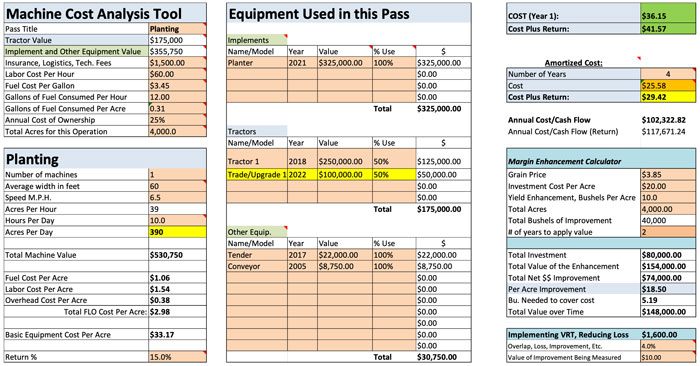
This example shows the planned trade/upgrade of Tractor 1 in the above Planter example to set the rates accurately in anticipation of a known change. This is incredibly value when farms look to make a change.
Parting Thoughts
Farm operations want and need more highly skilled and competent business partners as they progress and grow. You can be a part of the solution by helping them understand their cost, make informed decisions and act as a key resource.
This is not a pure sales tactic -- it is designed to truly bring value and clarity to the farms you work with. As a result, I’m confident you will help them with their decision, or “sell” them on your knowledge, expertise and caring.
This system has taken about 20 years to build and can be credited to Chris Barron. The tool we use is called Profit Manager, and it has been helping hundreds of high caliber, progressive farm operations make these decisions for decades. You don’t have to use this exact tool but should understand the concepts that go behind it. There are some intricacies in getting rates dialed in, but it is so necessary in today’s environment of high prices, tight margins and big decisions made at the farm level.
You can learn more about the system and calculating rates at farmprofitmanager.com, and can even buy it there if you’re interested and think it will provide value to your team and clients. You can also reach out, ask questions, and learn more about providing value to the farm businesses you work with by emailing me at shay@agviewsolutions.com. I’m happy to talk on the phone, too, at (319) 464-5708.
Thank you for letting me talk with you all about how we can help farm businesses and people make better decisions in their operation, and I look forward to hearing from you.Part 1: The 3-5 Year Equipment Outlook Tool
Part 2: Calculating Margin Enhancement on Farm Equipment
Part 3: Equipment Rates Built for Individual Farms & Equipment Companies