
When it comes to unit sales of farm machinery, in the past 5 years North American farm equipment dealers have seen the highest highs and the lowest lows they’ve experienced in the past 3 decades. As sales rose in 2012 and 2013, so did many of the industry’s operational and financial measures. Likewise, as sales began dipping in 2014, these same indicators reflected the industry’s downturn.
Many of these changes are reflected in the results of the 2016 Cost of Doing Business (CODB) study conducted by Equipment Dealer Consulting, P.C., the certified public accounting group affiliated with the Western Equipment Dealers Assn. (WEDA). Working in concert with various state and regional equipment dealer associations, WEDA compiled survey responses from 230 dealers who operate more than 600 store locations in the U.S. and Canada.
Working with the Dealer Institute, the educational arm of WEDA, an analysis of the study results was presented in a Farm Equipment webinar on Oct. 25, 2016. The presenters included Gord Thompson, a former dealer-principal, and Robert Charbonneau, a CPA with WEDA since 1983.
Summarizing findings of the study, Curt Kleoppel, president of Equipment Dealer Consulting, says total equity percentage increased almost 1.75% from a year ago and gross profit margin percentage increased last year. The overall net income before tax decreased 1%, which was one of the negatives indicated by the study. Dealers are still managing inventory, debt and used equipment values.
Stable Revenue Mix
Looking at the dealers’ revenue mix during the 5 years between 2012-16, only minor shifts occurred in the percentage of sales from new and used wholegoods. Parts and service revenues, on the other hand, saw healthy increases moving into 2016.
Interested in the Complete Report?
To get the complete report, dealers must contact their state or regional equipment dealer association. The 2016 report has been sent free of charge to equipment dealers who provided their financial reports for compilation. Non-participating dealers can purchase the results for $200 if they are association members; the report is $450 for non-members.
Questions? Call Lonnie Finch, CPA, at 800-762-5616 with questions or to learn how to access the survey results.
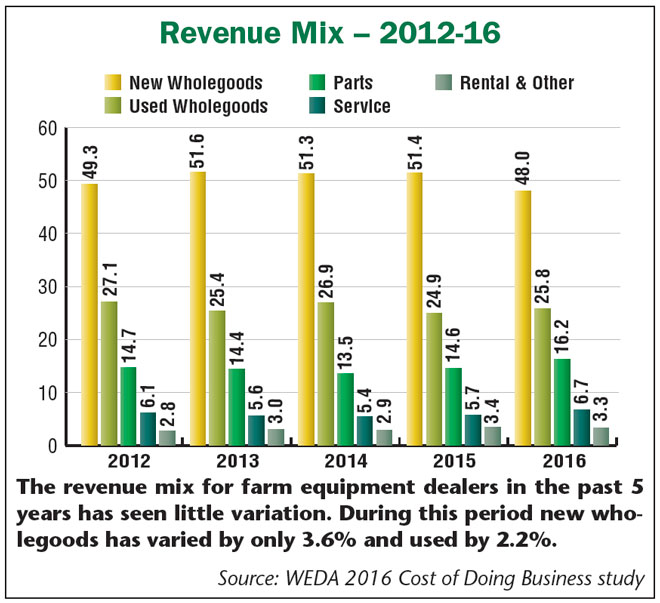
After rising to between 51-52% of total revenues during the period, sales of new wholegoods slipped back to 48% in 2016. Historically, the highest percentage of new equipment sales took place in 2005 when sales of new wholegoods exceeded 57% of total revenues. The 5 year average is 50.3%.
During the 5 year period covered in this report, revenues from used wholegoods peaked during the first year (2012) at 27.1% and dropped as low as 24.7% in 2015. Between 2012-16, revenues from used wholegoods averaged 26% of total dealership revenues.
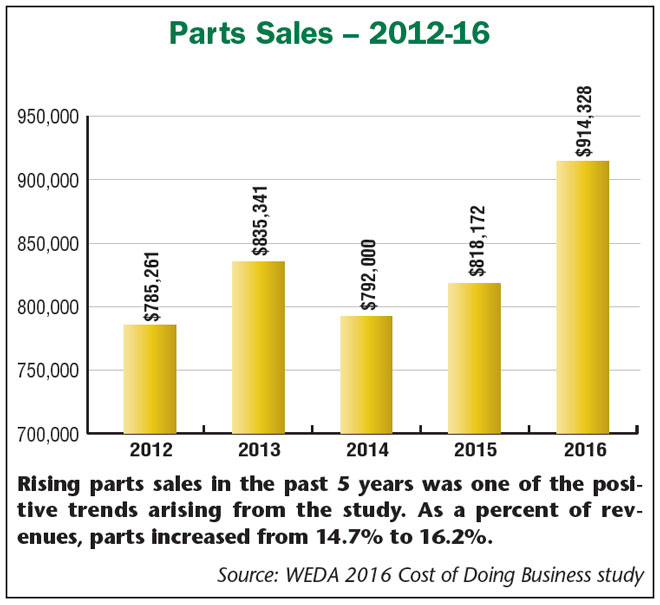
While slipping to only 13.5% of total revenues in 2014, by the time the 2016 study was conducted, parts sales recovered to 16.2%. This was up from the 5 year average of 14.7%, but far below the industry’s peaks. In 1985, parts revenues were nearly 24% of total revenues. Nonetheless, the increase that showed up in the 2016 results showed dealers were pointed in the right direction.
Likewise, service revenues experienced a healthy pickup with the most recent CODB study. After being stuck between 5-6% of total revenues between 2012 and 2015, results of the 2016 study saw dealerships’ service revenues approach 7% (6.7%). On average, dealers reported service revenues comprised 5.9% of total revenues during the 5 years considered in this report. This remains well off the peak of 8.9% that dealers reported in 2000.
Inventory & Asset Turns
If cash is king in the farm equipment business, then inventory turnover is what keeps cash flowing. According to Thompson, inventory turns are calculated by dividing total cost of sales by average inventory value. The WEDA report indicates that the industry benchmark for inventory turns is 2.5-3 times.
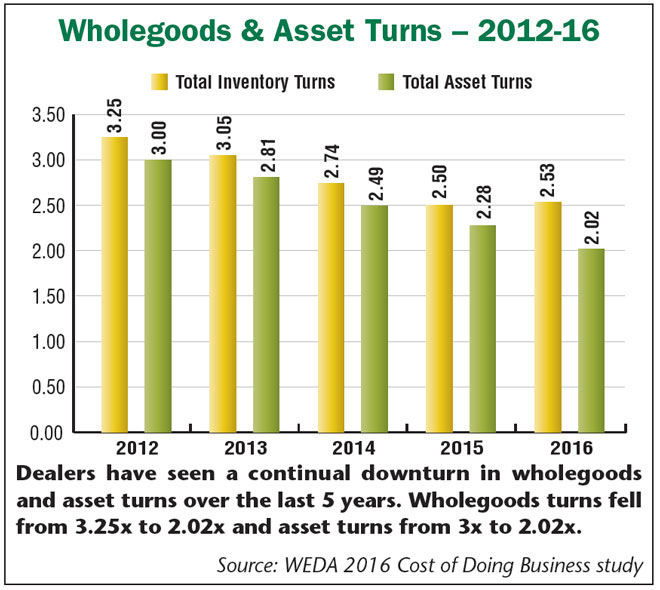
One example of strong industry performance during the boom years for equipment sales is, on average, dealers were turning their inventory 3.25 times in 2012 and 3.05 times in 2013. Since that point, turns have trended downward to 2.5 turns by 2015 and 2.16 times in 2016. Along with this, Charbonneau points out, as could be expected, inventories increased each year as turns decreased. “The result is dealerships are paying more in interest expense and more cash is tied up in older inventory sitting on their lots.”
Thompson adds, “Obviously inventory is top of mind for every dealer and we’re currently underperforming in this area. It’s causing a lot of dealership pain and when you combine it with where margins are headed on equipment, it makes it all the more painful. This is a trend we need to do something about.”
Like inventory turns, dealers’ have experienced similar declines in their total asset turns in recent years. Between 2013-16, asset turnover has dropped by 28% from 2.81 to 2.02, and by 11% between 2015-16. Charbonneau says increased inventories have been the biggest culprit.
Total asset turns are calculated by dividing total sales by average total assets. What it measures is how effectively you’re using your assets to generate sales, says Thompson. “This is concerning because when inventory turns decrease as they have, asset turns decrease at the same time, and these trends have a negative impact on return on assets.”
“If there’s a key component to this report, wholegoods inventory is it. We’ve got to get a handle on this to get a handle on the costs associated with it...”
Rising Wholegood Inventories
Lower inventory turns combined with higher wholegoods inventories have created dealers’ most perplexing dilemma during the past 3 or 4 years, according to Thompson. “If you’re experiencing pain in the cash department, the number one reason probably involves wholegoods inventory.”
Charbonneau points out that, on average, wholegoods inventory increased about a million dollars from $3.95 million in 2013 to $4.95 million in the 2016 study. With unit sales falling, increasing equipment inventories are particularly problematic for dealers.
“You just get more and more cash tied up in inventory that hasn’t sold and it puts a squeeze on [cashflow]. The impact is compounded during times like this when sales are declining,” says Thompson. “If there’s a key component to this report, this is it. We’ve really got to get a handle on our wholegoods inventory to get a handle on the costs associated with it.”
Thompson points out that part of the bloated inventory problem could have come about through dealer mergers and acquisitions. “Sometimes when there’s a merger, there’s a need to straighten out inventory situations. This could be a temporary phenomena that comes along with such moves.”
In all likelihood, the overall impact of mergers and/or acquisitions on inventory levels has been minor compared to other factors, which include the accumulation of higher value, low hour machinery during the boom cycle of 2010-13.
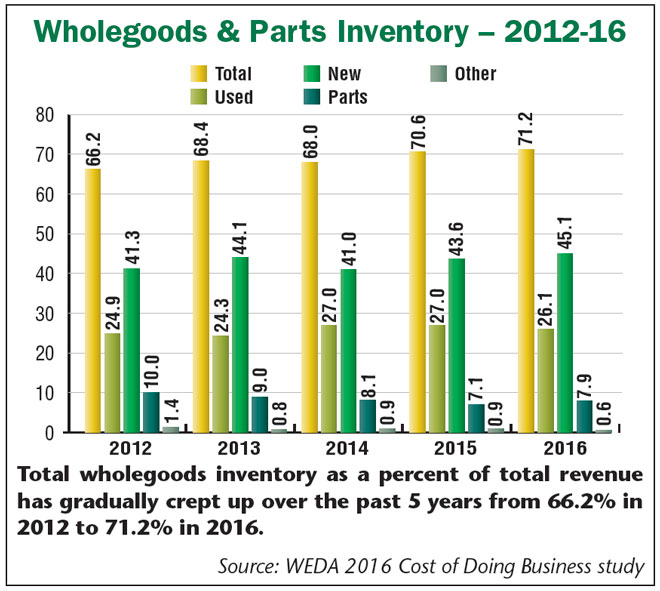
Overall, wholegoods inventory (new and used equipment) grew from about $3.2 million in 2012, or about 66% of total assets, to nearly $5 million in 2016, or 71% of assets. During this period, the inventory of new wholegoods ranged from about 41-45% and used wholegoods from 24-27%. When parts and other inventory are factored into the equation, total inventory increased to $3.8 million in 2012, or 77.6% of assets, to $5.6 million in 2016, or nearly 80% of assets.
Looking further back, new equipment inventories have remained relatively stable, ranging from about 40-49% in the early and mid-1970s to 1990. Since then new machine inventories have settled into the 40-45% range.
It is with used equipment where the biggest changes are seen. In 1970, used equipment comprised about 9% of total wholegoods inventory. This grew to 27% by 2014 and has remained in that area in 2015 and 2016. Parts inventory levels, on the other hand, have declined from 14% in 1970 to a range of 7-10% during the past 5 years.
Total Equity Paradox
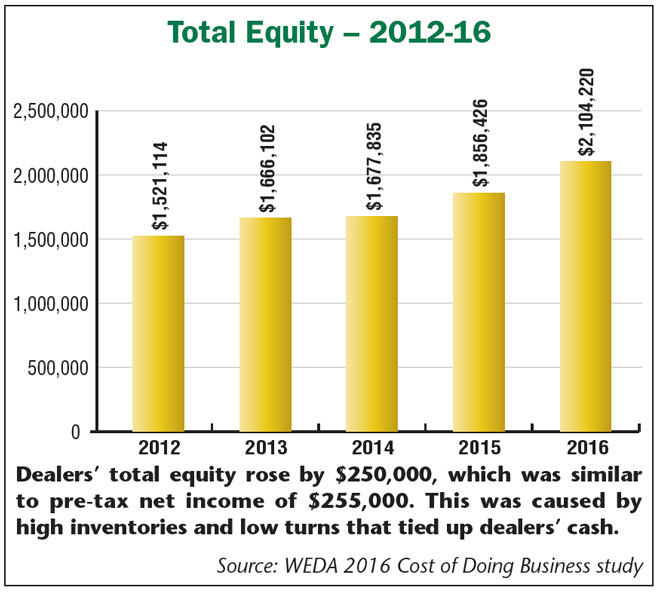
One of the ironies that emerged with the 2016 CODB study is the increase in total equity rose at about the same rate as pre-tax net income. “What would cause equity to go up at a rate faster than earnings?” Thompson asks.
He’s referring to the fact that 2016 net income before taxes was $255,000 while equity rose to $250,000, which means that the equity rose more than after tax income.
“High inventories and lower turnover will make this happen,” says Thompson. In these instances, the dealers’ equity is tied up in inventory and cashflow and earnings suffer.
He adds, in some cases, there are scenarios where dealers are contributing additional paid-in capital to meet manufacturer or banker requirements. “This means that equity is rising faster than earnings. So effectively, we have negative cashflow at that point from the owner’s perspective. This is not a long-term trend we want to see continue.”
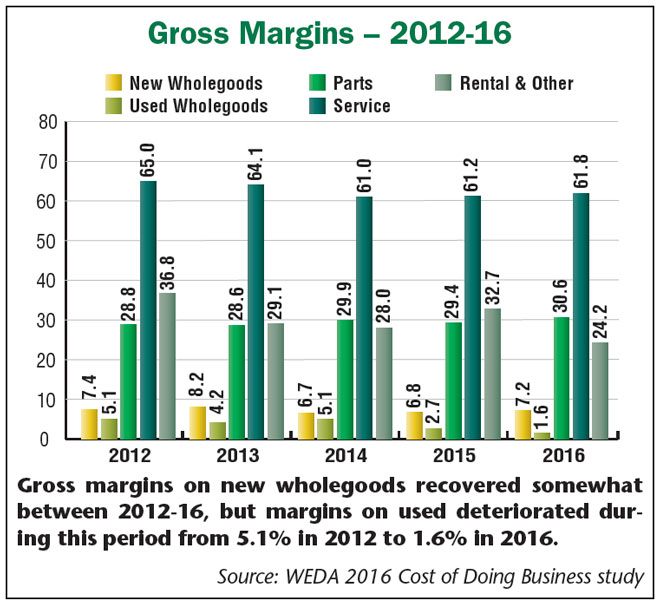
Mixed Margins
Dealer total gross margins over the past 5 years for all sales held their own, varying by only about 1% during this period. An examination of margins by department shows stability in new wholegoods and parts, but declines in used wholegoods and service.
“Money spent on floorplan interest doesn’t do anything to help the equipment sell faster, run better or make the end buyer any happier. It’s just dead money out the door and it gives dealers a reason to manage their inventories as well as they possibly can...”
Not surprisingly, the highest margin on new wholegoods occurred in 2013 when dealers reported an 8.2% margin, reflecting the high point for unit sales that also came about that year. The low was 6.7% the following year. The average gross margin on new equipment between 2012-16 was 7.3%.
Also, not surprisingly, gross margins on used machine sales steadily declined during this period. The industry posted a 5.1% margin on used wholegoods in 2012 and 2014, but dealers reported a gross margin on used of 1.6% in the 2016 study. The average margin on used equipment over the 5 year period was 3.7%. According to Charbonneau, the decrease between 2013-16 was about $260,000 in terms of dollars, or by about 33%. “This is not good,” he says.
Margin on parts sales climbed from 28.8% in 2012 to 30.6% in 2016. The average gross margin for parts over the 5 year span was 29.5%.
Dealers’ highest margins come from the service department, but between 2012-16, they weren’t able to maintain the 65% level seen in 2012. Service margins dipped as low as 61% in 2014, but rose slightly to 61.8% in 2016. The average over the 5 year span was 62.6%.
Used equipment margins are the biggest worry for dealers, according to Thompson. “When you combine lower turnover and lower margins, it worsens the situation. When I was a dealer, I tended to focus on the gross margin percentage. I had targets and wanted to maintain them. I would sometimes hang on to the used for a while to try and get my target margin because I was aware of the implications of dropping it.”
At the same time, he says, “It’s really not a sustainable situation we’re in right now in terms of the combination of turns and margins” and suggests dealers may have to change how they would like to price used equipment to what the market dictates.
He says as equipment dealers find themselves in the type of business environment that agriculture has been experiencing the past few years, they need to rethink their approach to used equipment. What is most important has always been gross margins times turns. For example, he explains, “Let’s say your target gross margin is 8% with a goal of 2 turns, which equals 16. If you lower it to 6% but can turn inventory by 3.25 times, this is 19.5, which is a better scenario. We all know the longer used equipment sits, the more expensive it becomes to get it up and running. Lowering your margin to move it quicker also improves your cash situation.
“I was guilty of hanging on to stuff for too long. What I’m seeing today with the big dealers is they’re a lot more prone to moving a piece of used faster to get rid of it. We need to stop getting married to our used equipment because it’s really causing us a lot of grief,” says Thompson.
Profitable Parts & Service
Thompson and Charbonneau both highlighted the increase to 16.2% of total revenue from parts sales as one of the positive trends emerging from the 2016 CODB study. This is up from 14.6% in 2015 and 13.5% in 2014. At the same time, the gross margin on parts sales also rose from 29.4% in 2015 to 30.6% in 2016. In total, parts sales grew by an average of $123,000 in 2016 vs. the year before.
“I congratulate dealers on this because it’s difficult to grow sales and margin at the same time and they’ve done both in the past year,” Thompson says. “But dealers shouldn’t be content at 30.6% margin because I believe we should be at about 33%. But the improvement this year is a nice move in that direction.”
While total service dollars increased by nearly $130,000 in the 5 years between 2012-16 — with $100,000 of this occurring between 2015-16 — its percent of total revenue grew from 6.1% to 6.7%, which Charbonneau and Thompson called “very good.”
During this period, the gross margin on service slipped from 65% in 2012 to about 62% in 2016, but improved from 2014 (61%) and 2015 (61.2%). “This is pretty good, but below where it needs to be,” says Charbonneau.
At the same time, Thompson says, dealers should focus on the service dollars more so than its percent of total revenue. “More is better to a point. We used to have a saying that you don’t buy your kid new shoes with gross margin percentages. You buy them with gross margin dollars. So a 62% margin isn’t bad, but the idea is sell more of it to take advantage of the high margins available with service sales.”
Charbonneau suggests that dealers take a hard look at shop rates to ensure they’re charging what they should be. “Farm equipment is getting very sophisticated and you need more qualified people to work on this very high dollar equipment. The market will determine what you can do, but dealers at least need to look at it.”
Thompson adds, “We tend to be shy about adjusting [our rates] because customers are vocal about it, but to some extent I think they’ve done a great job of training us. The big new equipment takes 3 times the space in our shops today than what it did when I started in this business.”
The investment in these big new shops alone is worth something, he says. In the space where a dealer was able to fit 3 pieces of equipment with 3 techs working, today that space will only accommodate one piece of equipment and one tech. “And relative to what others charge in industries comparable to ours, I think we’re pretty modest in what we do charge,” says Thompson.
Interest & Total Expenses
With the exception of 2014, dealers’ interest expense has risen steadily since 2012. In that year and the following year, interest was 0.45% of expenses. This declined to 0.44% in 2014 but increased to 0.52% in 2015 and 0.71% in 2016. The increase in dollars during the last 2 years was $22,492, or up by 30%.
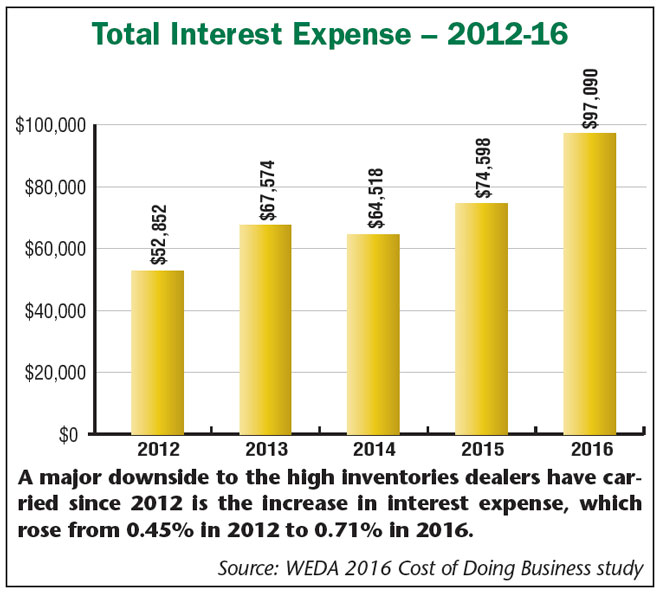
“Even though interest expense was up, it wasn’t up as much as you might expect relative to the inventory increase over the same period,” says Thompson.
He goes on to say that the reason interest expense is significant for dealers is that much of it goes into floorplanning. “Money spent on floorplan interest doesn’t do anything to help the equipment sell faster, run better or make the end buyer any happier. So it’s not like you’ve spruced the equipment up, it’s just dead money out the door, so again it gives dealers a reason to manage their inventories as well as they possibly can.”
In addition to the year-over-year increase in interest expense dealers experienced in 2015 and 2016, if interest rates rise, as expected, in the next few years, this could become a bigger issue than it is currently, according to Charbonneau. This should lend additional urgency to dealers’ efforts to better manage their inventories.
Overall, total dealership expenses have risen about 6%, or a little over $100,000, since 2013. “When you compare total expenses and margins, they are about the same across the board during this period,” says Charbonneau.
According to Thompson, it can be difficult to adjust expenses during a period of declining sales. “Not everything is tied directly to sales,” he says. “For example, you don’t get to decrease your rent just because your sales are down.
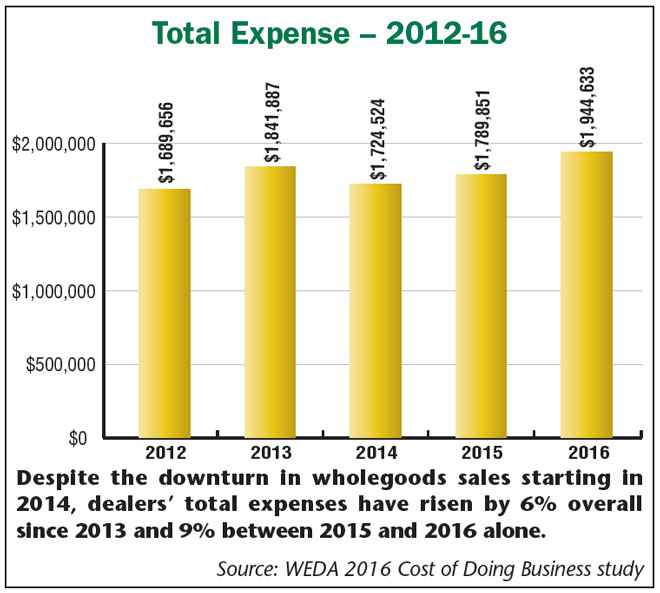
“When Bob and I studied the numbers, we were a little surprised that expenses increased as much as they did during this period of declining sales. We would have thought that there would have been some pretty serious pressure on expenses to mitigate the falling sales.”
Between the 2015 and 2016 studies, overall expenses increased by 9%. An examination of the numbers revealed that the single biggest increase dealers saw was in rent.
According to Thompson, without additional detail, it’s difficult to pinpoint exactly why this occurred. “Are owners charging more for an existing building or is it the result of new facilities that have significantly higher costs associated with them? Whatever the reason, the increase is significant,” he says.
Thompson suggests that dealer-principals work with department managers to carefully scrutinize all expense accounts to justify each and put in place zero budgeting. “Let’s not say we’re going to spend 5% less. We need to figure out where we are spending it and determine if it’s being spent wisely. I really believe that a strong budgeting effort and follow-up going forward is paramount because we sustain expense increases like this in the environment we’re in.”
Declining Profits
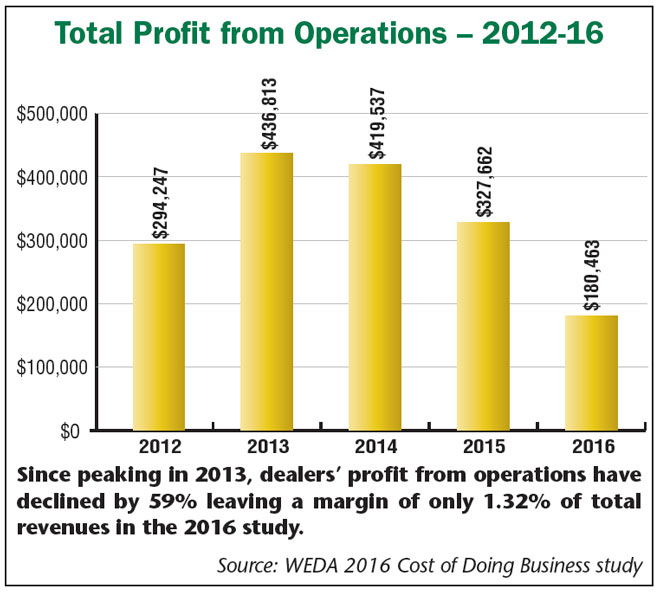
Not a very pretty picture is how Charbonneau described dealers’ profits from operations in the past year. “It went from nearly $437,000 in 2013 to about $180,500 in 2016,” he says. “That’s about a $256,00 decrease in total dollars and is 59% lower than operations profits dealers saw in 2013.”
Year-over-year, dealers’ profits from operations fell by 45% in the 2016 study. “At 1.32% [of revenues] dealers are still in the black, but that’s a real thin margin,” says Thompson. “It doesn’t let you ride out any surprises or make a significant investment where it’s needed. It really needs to be in the 3% range for a dealership to be successful and make it work.”
Further analysis reveals that profits from dealer operations ($180,463) would actually be in the red if volume discounts ($204,427) weren’t included.
Thompson says when he was a dealer, this situation is the one that he most wanted to avoid. “I scratched like crazy to keep my sales department profitable without volume discounts because [they] are somewhat at the whim of the manufacturer. And you can’t forecast what it’s going to be for the coming year. We can’t totally hang our hat on that as a business model, so let’s figure out how to make money without it.”
Slumping ROE & ROA
Ultimately, the annual overall performance of a business comes down to net income, but there are other measures that dealer-principals must watch closely. These are return on equity and return on assets. Both of these are also important to lenders the dealership works with.
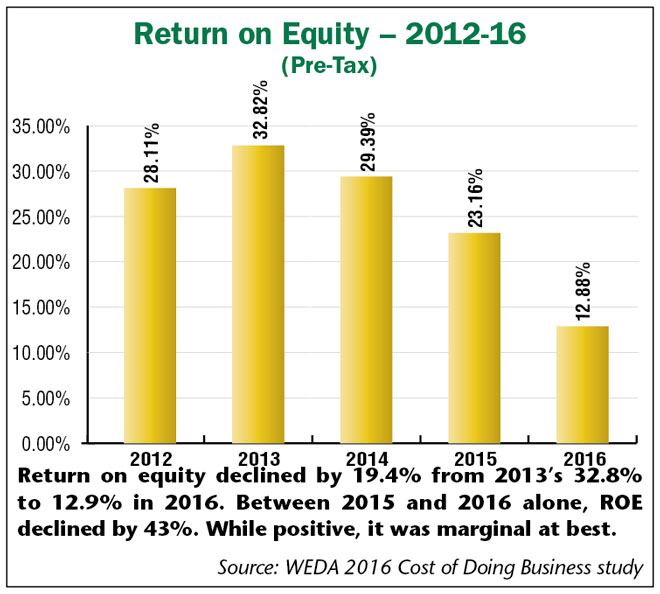
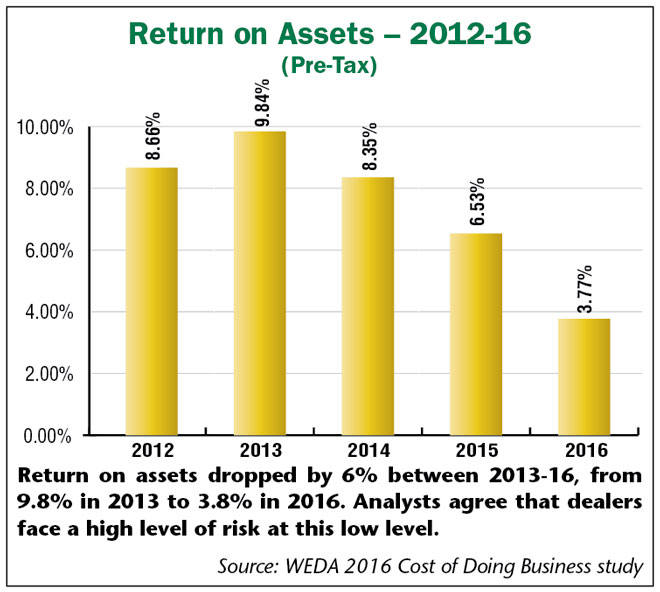
Unfortunately, Charboneau says, neither fared too well in 2016. “Return on equity declined by 19.4% from 2013’s 32.8% to 12.9% in 2016. Return on assets followed suit, dropping by 6% during the same period, from 9.8% in 2013 to 3.8% in 2016.”
Between 2015 and 2016, ROE declined by 43%. “It’s still positive, but it’s marginal at best,” says Thompson. “At that level it takes a lot of fun out of the business. Everybody from your manufacturer to your banker to potential investors wants to know what this number is and with good reason. It is a measurement of net income before taxes divided by average net worth. The productivity of the owner’s investment is what it measures.
“This year we have two things working against us. We saw that assets have gone up because we’ve sold less equipment, and our equipment inventories have risen. Our equity has also risen because we haven’t been able to extract the cash, perhaps it’s tied up in that equipment, and then we’ve had declining income. So this one’s getting hammered on both ends, income’s down, average net worth is up because of inventory and equity. If I was a potential investor, this is the first number I would look at.”
Return on assets is another measurement tool that lenders and investors zero in on. It’s calculated by dividing net income before taxes by average assets. Dealerships posted a 3.77% ROA in the 2016 study, which is down significantly from the 9.84% level achieved in 2013.
“You take a lot of risk for that 3.8%. We need to have it in the 6-8% range. As is the case with ROE, we’re getting drilled on both sides of it on ROA because income’s down and assets are up. It measures the company’s ability to utilize its assets to earn a net profit. This really cuts to the chase of why we’re in business.”
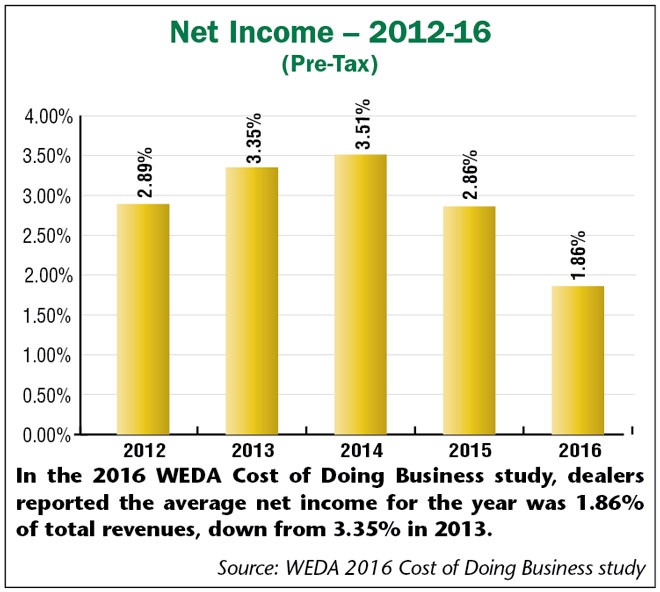
It all boils down to net income. In the 2016 WEDA Cost of Doing Business study, dealers reported their net income for the year was 1.86% of total revenues. This is down by a full percentage point from the 2015 study and down by 1.5% from the 3.35% net income posted in 2013.
Employee Head Count Rises
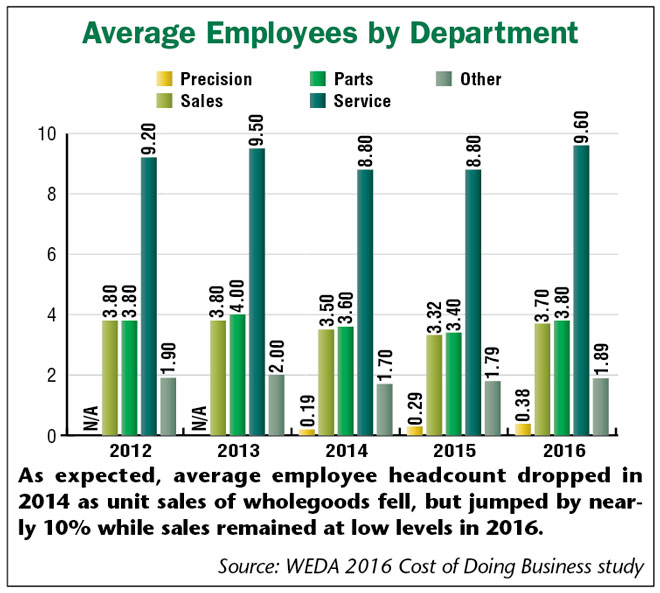
As equipment unit sales began to decline starting in 2014, farm equipment dealerships, on average reduced their employee rosters by about 1.5 people (8%) from 19.4 in 2013 to 17.8 in 2014.
“Overall, our workforce stayed pretty constant from 2013-16, but it’s went up quite a bit from 2015-16 from 17.6 up to 19.4, which is about a 10% increase in employees even as profits decreased,” says Charbonneau.
“I found that surprising, too,” adds Thompson. “Perhaps dealers had to add specialists in their service department to deal with all the complicated technology that we sell now. But along with the increase in overall expenses, it was surprising to see an increase in average number of employees.”
WEDA added the category of Precision Ag/IT Technician to their survey in 2014. While the average number of employees in this category doubled from 2014-16, from 0.19 to 0.38, this would not account for the 10% increase in overall headcount during this period.
“I’m not hearing dealers say that they’re adding employees and yet that’s what the numbers tell us. Could be a result of some mergers and acquisitions, otherwise we’re struggling a bit to explain this,” says Thompson. “My goal was always to do a million dollars in sales per employee and generally we did. We’re now down to about $700,000 and it just gets a lot tougher to generate a bottom line that works for everybody at that level.”
Aftermarket Absorption Needs to Improve
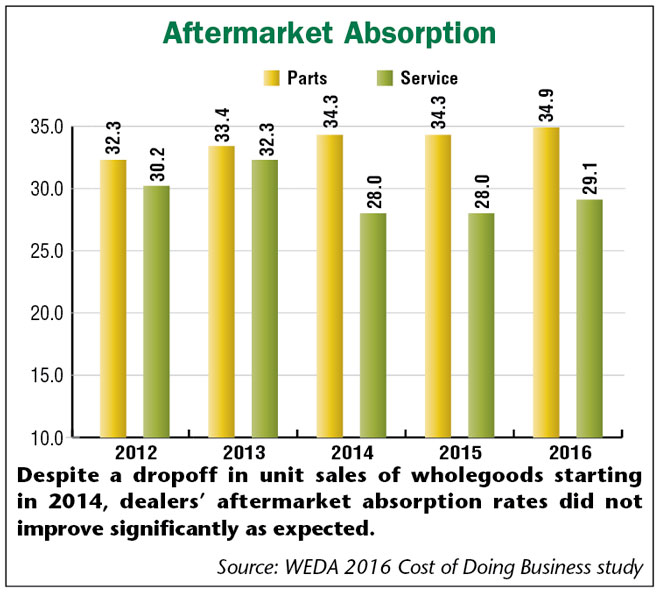
For many farm equipment dealers, aftermarket absorption is a critical measurement. It is calculated by dividing parts and service gross margins by total expenses. The higher the absorption rate, the more fixed costs are covered. This tends to take on more importance during periods when unit sales decline.
WEDA indicates that the benchmark or target for farm equipment dealers for parts and service absorption is 80%-plus.
While total absorption crept up somewhat between 2012-16, from 62.5% to 64%, it would appear that, on average, dealers remain highly dependent on new and used wholegood sales to remain solvent.
Parts absorption improved slightly (2.6%) during this period, service absorption actually declined from a peak of 32.3% in 2013 to 28% in 2015 before recovering somewhat to 29.1% in 2016.
Dealer Takeaways
After scrutinizing the 2016 study, Thompson offered his closing thoughts.
Takeaway #1: “We must figure out how to improve our inventory turnover. This is the thing that’s hamstringing us most right now. We all know this is more difficult to accomplish when sales are harder to come by. We’re down close to 2 turns on used and we’re also contending with low margins.
“We always used to say that turns needed to be 3 times to be successful. I would advocate that it now needs to be 4 times. We have to get our people to understand why it’s important that that piece of used equipment doesn’t sit behind the shop for a month before you make it suitable to sell; why your sales department has to do a better job of finding homes for equipment before it comes in the door.
“It seems we’ve lost the urgency we used to have about moving used. It’s gotten away from us. I think it’s a carryover from the ‘good times’ when we got used to equipment finding its own home instead of us going out and finding a home for it. This has to be the single biggest thing we focus on.”
Takeaway #2: “I would say we’ve made a great start in parts and service, but we’re only about a third or a quarter of the way to where we need to be. We don’t have a lot of upside in our service gross margin, but we have a little bit of upside in parts gross margin. If we can get just 2 more points in parts gross margin, it’s amazing what sticks to the bottom line. So kudos to what you’ve done there, but don’t stop.”
Takeaway #3: “The other thing that jumped out at me is we need to figure out how to better control expenses. This is a tough one, and I’m not going to underestimate what’s involved. But necessity is the mother of invention, and we’re in a situation where we have to figure out how we’re going to make the changes to make this work for us. I would do a really thorough budget analysis and I would have all my people involved.”


