Reading about projections for a significant falloff in net farm income and cash receipts in the year ahead might lead you to think that farmers are in desperate shape. But the fact is after coming off 4 or 5 really strong years, as a whole, U.S. farmers are sitting pretty nicely when it comes to strong assets and low debt levels.
In its February 18 report to congress, the Congressional Research Service says that U.S. farmers are in solid shape going into 2015 despite low commodity crop products.
Citing USDA’s Economic Research Services (ERS) most recent data, the CRS report acknowledges that the forecast for national net farm income is forecast at $73.6 billion in 2015, down 32% from last year’s level of $108.0 billion. The 2015 forecast would be the lowest since 2009. At the same time, net cash income is projected down 22.4% in 2015 to $89.4 billion due to the outlook for lower crop and livestock receipts — down a combined 6.3%.
Despite uncertainty about commodity prices and some softening in land values, other economic measure suggests that the agriculture sector remains in a “relatively strong financial position heading into 2015.”
Here are some of the indicators that measure U.S. farm wealth:
• Farm asset values — which reflect farm investors’ and lenders’ expectations about long-term profitability of farm sector investments — are projected up slightly (0.4%) in 2015 to $3,005 billion, reflecting a leveling off of the previous year’s strong outlook for the general farm economy.
• Continued strong farm asset values are expected despite weaker farm real estate values, projected down 0.8%. Real estate traditionally accounts for the bulk of total value of farm sector assets. All other farm asset values are projected up 5.4%, thus offsetting the lower outlook for farm real estate.
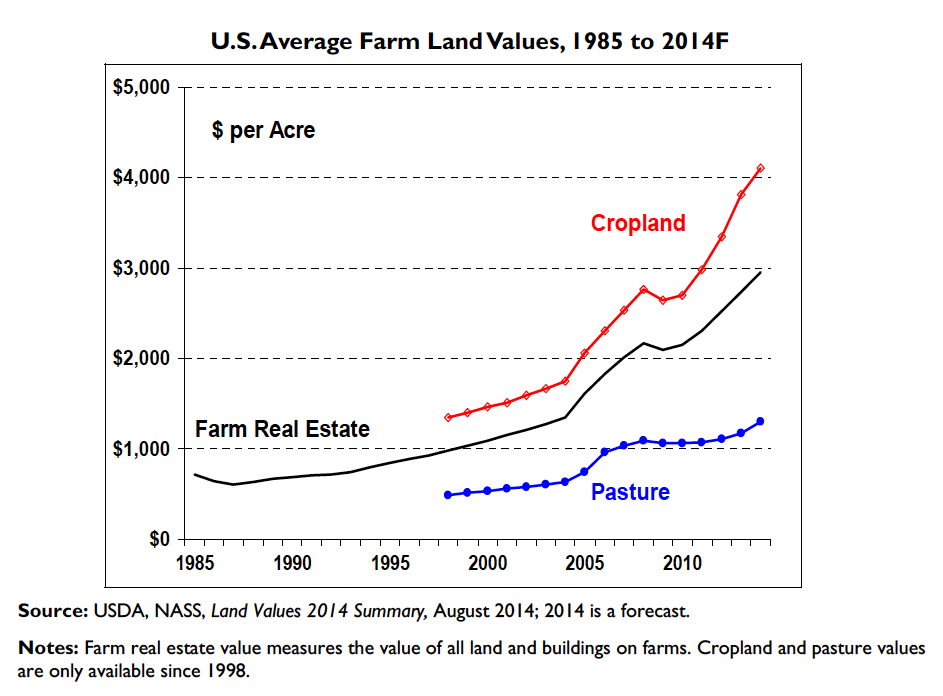
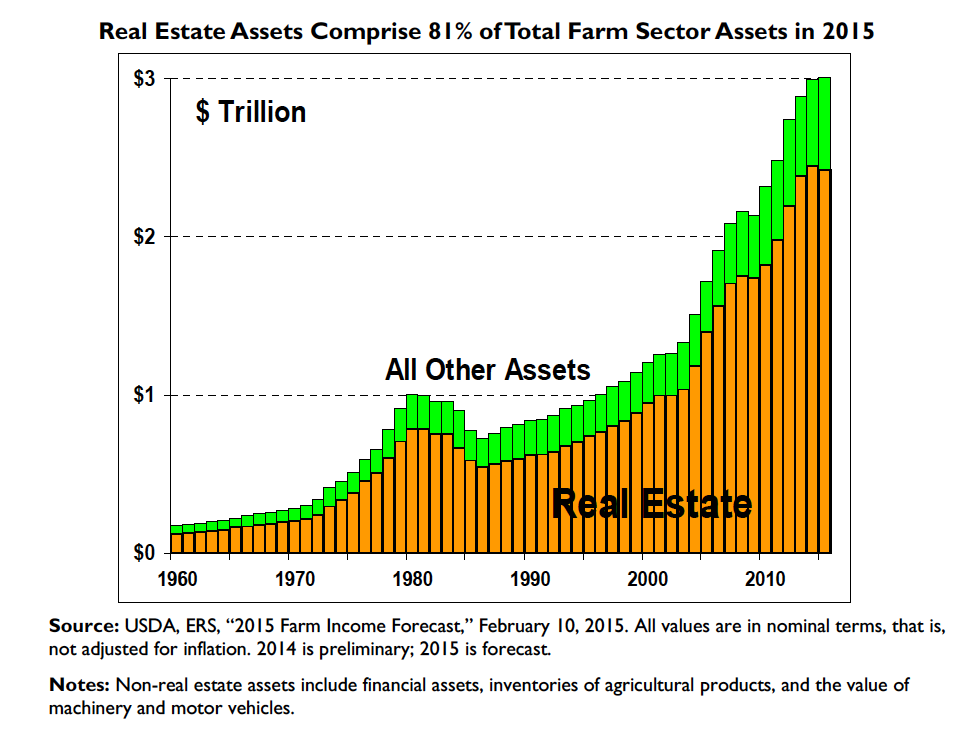
• Despite the projected decline in 2015, farm real estate values have grown by an estimated 41% since 2009, due largely to strong crop prices. In 2015, real estate assets are expected to account for nearly 82% of total farm assets.
• Land value growth is closely linked to commodity prices and is expected to plateau or recede slightly if the forecasts for lower commodity prices and the prospect for continued global stock recovery for grains and oilseeds are realized in 2015 and beyond.
• Meanwhile, total farm debt is forecast to rise to $327.4 billion in 2015 (up 3%).
• Farm equity (or net worth, defined as asset value minus debt) is projected to be up marginally at a record high of $2,678 billion in 2015.
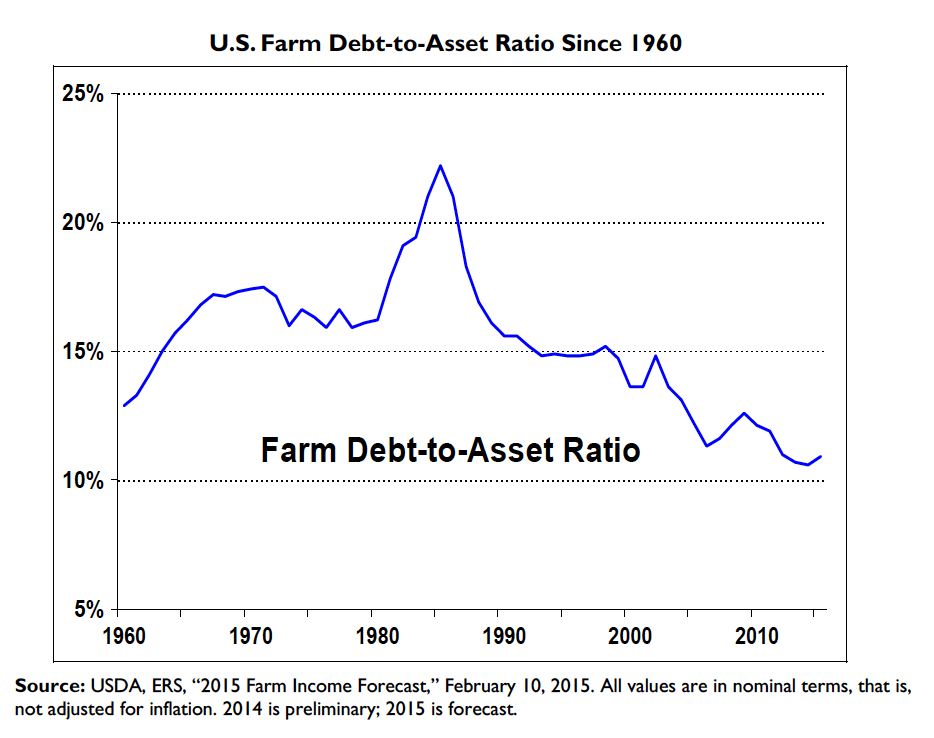
• The farm debt-to-asset ratio is forecast at 10.9% in 2015, up slightly from the preceding two years, but still the third lowest level on record. [Fig. 27]
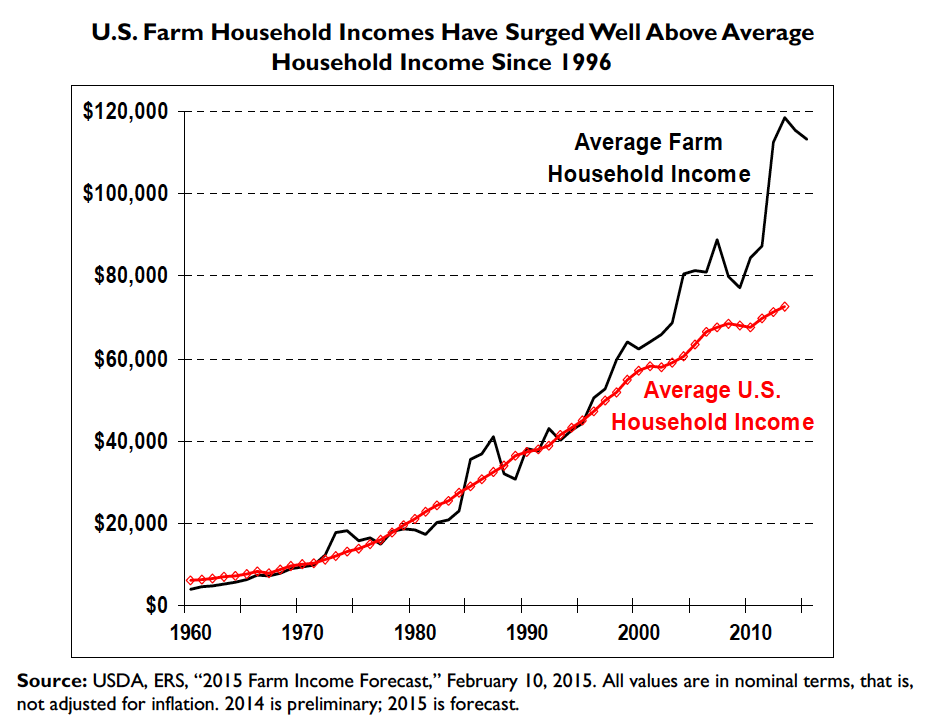
The solid performance of the U.S. farm sector has also left farm households in good stead. Since the late 1990s, farm household incomes have surged well ahead of average U.S. household incomes. [Fig. 29] In 2013 (the last year for which comparable data is available), the average farm household income of $118,373 was about 63% higher than the average U.S. household income of $72,641.