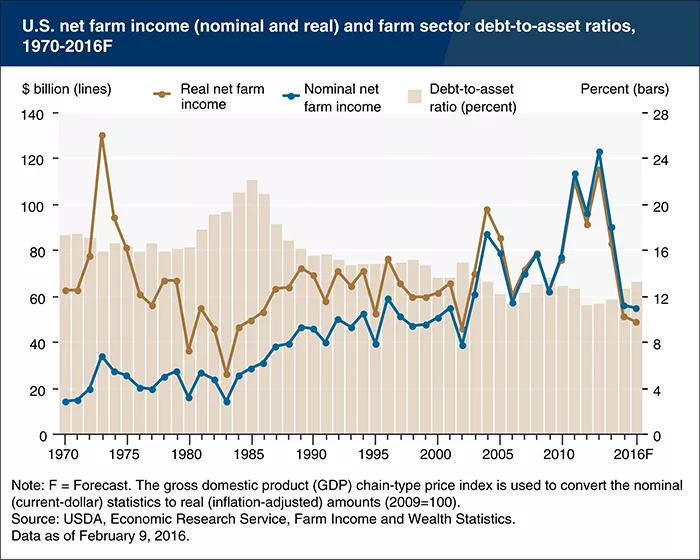
National net farm income, along with the farm-sector debt-to-asset ratio (which is a measure of solvency), provide indicators of the economic well-being of the U.S. farm sector.
As of February 9, 2016, U.S. net farm income is forecast to fall to $54.8 billion in 2016 after recently peaking in 2013, due largely to declines in commodity prices.
In inflation-adjusted terms, since 1970 only 5 years have registered lower net farm income. With the exception of 2002, all of those years were in the early 1980s, a time of great farm financial stress.
The sector’s debt-to-asset ratio has edged up the past several years but at 13.2 percent remains well below the ratio’s 1985 peak.
Recent inflation-adjusted debt levels are near, but have not exceeded, early 1980s levels. Thus, the improvement in farm-sector solvency has hinged on farm-sector asset values, which have roughly doubled since 1985 in inflation-adjusted terms.
About 80 percent of the value of farm-sector assets are attributable to farm real estate, and both farm real-estate and nonreal-estate assets are expected to experience modest declines in 2015 and 2016.
This chart is based on data found in Farm Income and Wealth Statistics, released February 2016.


