***UPDATE*** Jan. 26, 2016
Since posting this outlook report, we've received several questions about Glass Management Group's 2015 Outlook vs. Actual Results. Charlie Glass shared that with us, too. Here it is:
2015 Tractor & Combine Outlook
Also, here's actual data from January 2016:
Editor’s Note: During the last few years, we’ve had an ongoing conversation with Charlie Glass of the Glass Management Group (GMG) about farm equipment forecasts and OEM shipments to dealers vs. dealers’ retail sales. For several years Charlie has been developing his own annual outlook for tractor and combine unit sales, as well as field inventory and retail sales.
It’s an interesting approach, so we have decided to share it with Farm Equipment’s readers on a monthly basis. We’ll update it with the “actuals” monthly as reported by the Assn. of Equipment Manufacturers. Charlie will also provide us with a brief monthly blog, which will review his forecast and developments he’s observed that impact ag machinery sales.
For the record, Charlie has been working in the farm equipment industry for 40-plus years, he’s chairman emeritus of the Farm Equipment Manufacturers Assn.’s Dealer Relations Committee. He is currently one of the judges for both Farm Equipment’s and Rural Lifestyle Dealer’s Dealership of the Year programs.
* * * * * * *
Farm Equipment Shipments, Inventory & Retail Sales Outlook 2016
Charles Glass, Glass Management Group, Arlington, Texas
Tractor sales are the lifeblood of the farm equipment industry. They are the barometer for the sales of all other agricultural equipment, whether it is tractor mounted or self-propelled.
We have produced an annual forecast for tractors and combines for the past 10 years. The base data we use in our calculations is derived from the Assn. of Equipment Manufacturers’ (AEM) monthly Flash Reports.
This forecast was developed from various matrices that consider factors that will affect the number of units for each category. Some of these factors include:
- Net farm income
- Commodity prices
- Export activity
- Currency exchange rates
- General farm economics
- Current tax provisions
- Farm debt (debt-to-asset ratio)
- General economic conditions
- Field inventory levels (new and used)
We not only forecast for shipments but also for field inventory levels and retail sales results for each month and the full calendar year. Each month the forecasted amount is compared to the actual results to determine the accuracy of this effort.
Last year I had a very good forecast for the smaller tractors, but had a big miss on the larger ones since I did not build in the impact (or lack thereof) that Section 179 would have on the market. I am confident that the 2016 numbers (shown below) will be very close for all of the equipment categories. As I have been producing this forecast for 10 years now, I have also been refining the matrices to better target a more accurate forecast.
Shipments to dealers are certainly sales for the manufacturer, but they are a poor representation of the real activity taking place at the local dealership. But shipments to dealers only add to their inventory until they actually sell the unit to one of their customers in the form of a “retail sale.”
The “retail sales” numbers shown below are based on a calculation that comes from beginning inventory plus shipments minus ending inventory. I have been using this formula for about 25 years to calculate the relative change in inventory.
In our industry, this is the most accurate means of determining units sold by dealers. I believe “retail sales” gives a much more accurate picture of that activity and of the real health of the farm equipment market, in general.
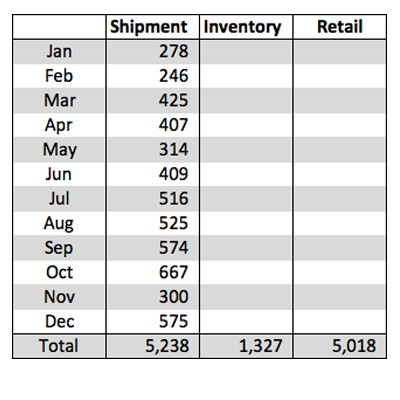
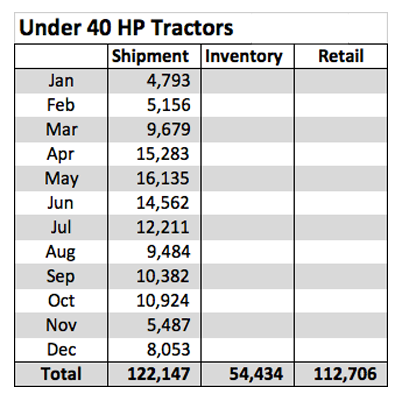
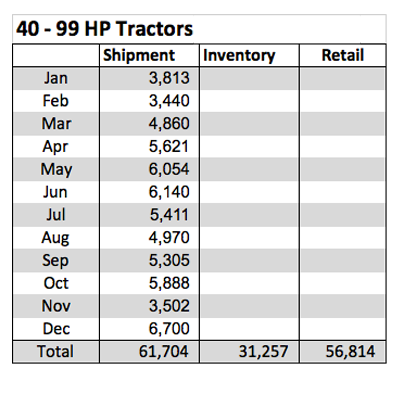
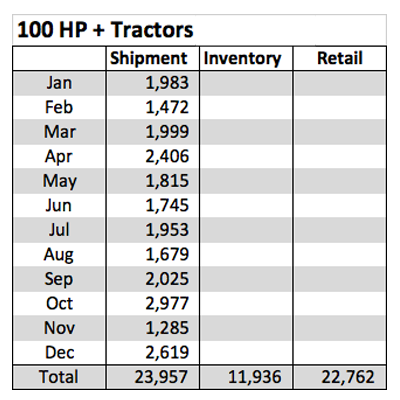
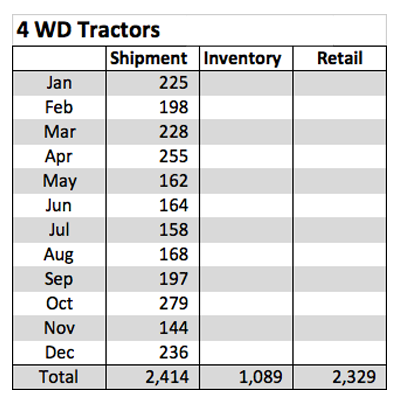
Following is GMG’s 2016 month-by-month forecast, along with our forecast for the ending field inventory numbers and the retail sales forecast for each of the tractor categories and combines.
2016 Forecast for U.S. Tractors
2016 Forecast for U.S. Combines