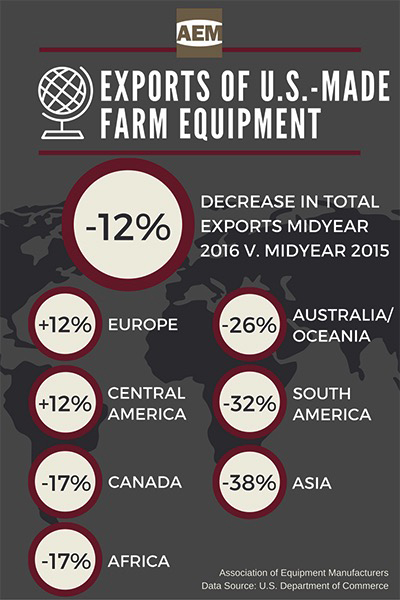
MILWAUKEE — Exports of U.S.-made agricultural equipment at midyear 2016 dropped 12% overall compared to the first half of 2015, for a total $3.54 billion shipped to global markets.
Europe and Central America continued to show growth, with the double-digit declines in other world regions led by Asia and South America, according to the Association of Equipment Manufacturers (AEM), citing U.S. Department of Commerce data it uses in global market reports for members.
AEM is the North American-based international business group representing the off-road equipment manufacturing industry.
Exports by World Region
AEM Market Overview
“Midyear 2016, U.S. agricultural equipment exports to the world continue to decline, though lower than in previous quarters. Looking at the Q2 results of our North American Agricultural Equipment Industry Conditions Trends Survey, which tracks the perceptions of member manufacturers, of those that exported goods, 33% of respondents indicated falling exports and 40% indicated stability,” said AEM’s Benjamin Duyck, director of market intelligence.
“It is important to note that while ag equipment exports might suffer double due to the overall ag downturn, a deterioration in export levels is a nationwide problem. With the global economic malaise, the slowdown in emerging markets and the negative interest rates in several economies’ bond markets, investment is flowing to the U.S. and U.S. stocks, driving up demand for the U.S. dollar, inadvertently affecting our competitiveness abroad.”
Exports by Top 10 Countries
The top countries buying the most U.S.-made agricultural machinery during the first half of 2016 (by dollar volume) were:


