Earlier this year I wrote an article titled “There’s No Easy Button for Used Equipment Valuations.” The column outlined how paying attention to the markets and understanding history is a more foolproof method of evaluating equipment. In this article, I want to explain some of the reference points I use to see the health of the overall market as well as my current used inventory.
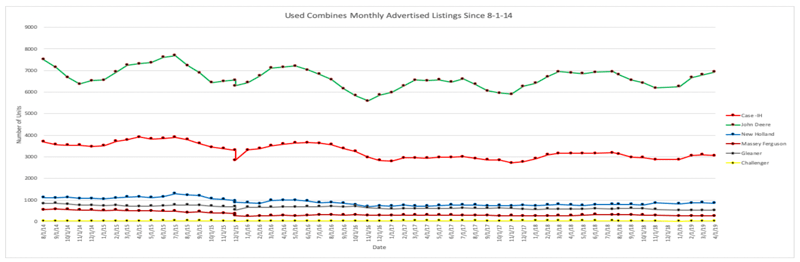
What is on the internet? Every month I get a spreadsheet with several machines and machine categories from TractorHouse.com and MachineryPete.com. It lists the numbers of machines in each category and by the manufacturer. I have this data back to August 2014. The categories included are combines, combine platform heads, combine row-crop heads, 175+ horsepower tractors, 100–174 horsepower tractors, sprayers, self-propelled forage harvesters and planters. These are the number of machines listed on various internet listing sites, respectively. I don’t add up the machines listed on each site. I look at the total number of machines listed. I use Machinery Pete and Tractor House because they have the largest number of machines. Mind you, there is much overlap between the sites, which allows for a better market feel.
So for example, In April 2019 the used combine market was comprised of the 12,485 used combines. Of the manufactures I track, this is the breakout. John Deere 6931, Case IH 3053, Massey Ferguson 266, Gleaner 533 and Challenger 29. I have recently added Lexion/Claas to the mix. I also track specific models for each category. Since I work for a John Deere dealer and the overwhelming amount of used equipment traded is John Deere, I track are all John Deere models. Continuing with the combine, these were the numbers for April 2019:
- S660 — 454
- S670 — 1,201
- S680 — 1,343
- S690 — 398
I have recently added S700 Series combines to this list.
So now that I have all this data, what do I do with it? Like anything, the data gathered is only good if used. I use this bulk data to see what inventories are doing month-over-month and year-over-year. These data points help paint a picture of what the market is going to do. I look back at the same month a year ago and see if inventories were higher or lower than the current month. I do the same for the 3 months leading up to the current month to see if any trends are developing and compare back to a year ago.
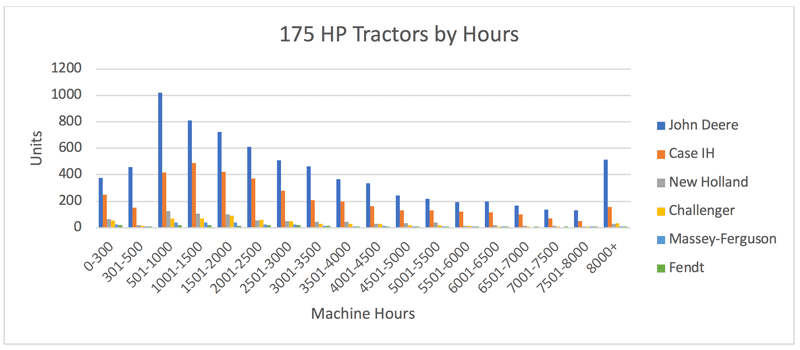
To me, the past year is the most important, but going 3 and 4 years back is a great trend indicator. I take the data and make a graph for each month — not only of bulk data but also the hour breakouts for each manufacturer
Data points me in the right direction. It doesn’t give me trade values or what a machine is worth in the future — it merely gives me a reference point in time and market supply. I still have to determine market demand of not only my local market but, the market as a whole. The internet has made the world a tiny place and transportation cost, as a percent of the sale price, has made buying equipment even more of a commodity. It is paramount that used equipment managers understand what is on the internet — not just value, but supply. The better-understood market influencers are, the more profitable used equipment becomes. Those who do not know their history are doomed to repeat it.

Farm Equipment‘s Ask the Expert: Used Equipment series is brought to you by Iron Solutions.
At Iron Solutions, we provide used equipment valuations, market intelligence and a suite of integrated, cloud-based business systems custom-tailored for the equipment industry. Our proprietary model is built on actual dealer sales transaction data. Learn more…