As the North American farm equipment industry confronts its first slowdown in wholegoods sales since 2009, dealers have turned their focus more sharply than ever to other revenue-producing operations. As a result, other areas, like aftermarket parts sales, are coming under close scrutiny to determine where they can fill revenue gaps resulting from declining equipment sales.
To get a better idea of where the industry is when it comes to its parts operations, Farm Equipment surveyed dealership parts managers and general managers in mid-December. The results represent input from a good cross section of ag equipment dealers across North America by brand (Fig. 1), employment size of parts departments (Fig. 2), and customers served (Fig. 3).

|

|

|

|
A large majority of dealers participating in the survey see solid potential for growing their parts sales in the year ahead. Overall, nearly 72% of them expect part sales to increase in 2015, while 20% are forecasting a slowdown. The remaining 8% see little or no change from sales levels seen in the year before. Generally, dealers see the parts segment of their business increasing about 7.5% in 2015 (Fig. 4).
To help put the survey data into context, we turned to industry partner George Russell of Currie Management Consultants for his perspective based on his nearly 4 decades of experience working with hundreds of dealerships.

|
Emphasizing Part Sales
While manufacturing farm machinery as an OEM and retailing it as a dealer require distinct disciplines and skillsets, the sale of parts presents both groups with solid revenue potential regardless of market conditions. To emphasize its importance, Deere & Co., the world’s largest manufacturer of ag machinery, emphasizes its annual parts sales in the company’s Fact Book.
In the most recent edition (Dec. 19, 2014), Deere provides data on the past 10 years of service parts sales. Between 2005 and 2014, parts sales as a percentage of total equipment sales varied only slightly in the range of 15-17%. During that same timeframe, total parts sales increased from $2.9 billion to $5.5 billion as Deere’s total net sales of equipment rose from $19.4 billion to $33 billion.
While we have no previous survey data for comparison purposes, according to the December survey results, over the past 3 years more than one-half (56%) of dealers’ revenue from parts sales exceeded 16% or more of total revenue (Fig. 5). At the same time, the single largest group of dealers (40%) fell in the range of 11-15% in part sales as a percent of total revenue.
The data from this survey should not be considered industry benchmarks. It merely provides dealers a point of reference for comparison purposes. As we follow up with similar studies in the future, it will help to establish some longer term trends in terms of parts operations.
Reviewing the Numbers
In his overall analysis of the survey results, Russell says, “What I see here is a mix of good and bad practices. Generally speaking, I would say the industry is doing fairly well when it comes to its parts operations.” At the same time, he concedes there are some areas that need some attention.
In terms of parts department employees, nearly 70% of the dealers indicated that 11% or more of their employees work in the parts segment of the business. This means for a dealership employing 30 people, from 3 to 5 people focus on parts operations.
“It was surprising that 44% of the respondents said they had 16% of their employees in the parts department,” says Russell. “This shows a pretty robust contribution of parts to the business, which also shows up in the revenue from the parts department (Fig. 5). We like to see this number north of 20%. But over half of the dealerships are getting a high portion of their revenue from parts sales, which is pretty good.”
|
|

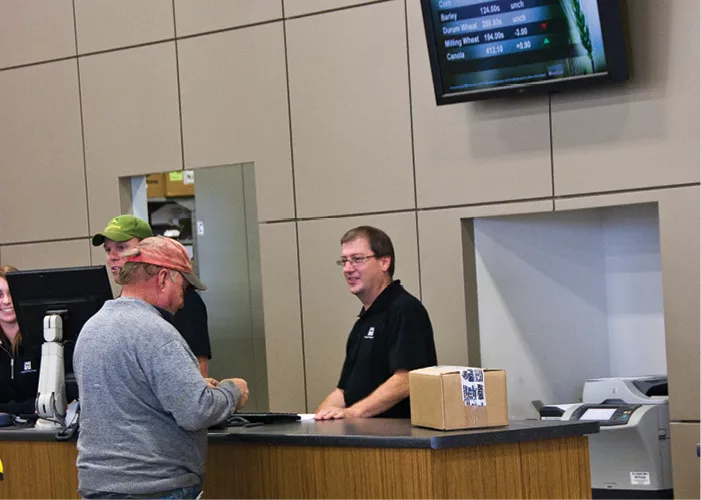
OTC vs. Shop Parts
Where part sales originate is also an important measure for dealerships to monitor. The survey indicated that over half (55%) of part sales come over the counter from external customers (Fig. 6). More than one-quarter originate from the dealership’s service business, and another 10% result from internal customers (equipment set up and delivery, parts tied to wholegoods sales, etc.). The remaining 8% or so are attributed to warranty work.

|
Clearly, these dealers do a lot of business over the counter, which is pretty standard, says Russell. “Internal customer parts and warranty work parts result from new wholegood sales. When these are growing, it usually means the dealership is delivering a lot of equipment. As machinery sales slow, we should be looking for other ways to increase business through the shop because this is where you have the most potential to increase parts sales, particularly by increasing the dealer’s repair business.”
Parts Pricing & Profitability
Another area that requires close scrutiny is how dealers are pricing their parts. Nearly two-thirds (63%) of the dealers participating in the survey indicate that there is no difference between what they charge internal customers for parts compared with their external customers. The remaining 37% say they differentiate their pricing for internal and external customers (Fig. 7).

|
“Whether or not a dealership discounts parts internally is a universal issue. It appears that nearly 40% of dealers discount parts for internal customers, but I would suggest that they take a hard look at this area.”
Going along with this data, the survey also showed that for 70% of the dealers there is no difference between the gross margin they earn on parts purchased by external customers and those utilized in the dealership’s service department. For the remaining 30% who discount on over-the-counter parts, the difference can range from less than one point to more than 3 points (Fig. 8).

|
“Overall, I would say the 70% is a pretty good number. From my experience, there is usually a difference in the gross margin dealers earn on shop compared with over-the-counter parts,” says Russell.
When it comes to margin generation through OEM parts sales vs. shortline parts, Russell sees a very healthy trend. According to the survey, there is no significant difference between the margins earned with OEM parts (32.5%) and with parts supplied by shortlines (32.1%).
“This is very good because the range should be 30-35%,” Russell says (Fig. 9). “There are dealers who complain that the manufacturer and inline competition doesn’t allow them to get over 30%. That’s not what this survey says. It demonstrates that, overall, dealers are right in the middle of the range of where they ought to be. And, keep in mind; this is an average, so half the dealers are above this number. So this good news as well.”

|
Examining Other Metrics
The survey results also provided insight into other metrics dealers associate with the performance of their parts operations. Among those studied are parts inventory turns, fill rate and parts absorption.
On average, dealers who participated in the survey indicated their parts turns were 2.3 times. Average for the fill rate was 82%, which means customers are leaving the dealership with the parts they wanted 82% of the time. Average parts absorption came in at 53%.

“The art of the parts business is to balance your inventory turns with your fill rate,” says Russell. “Ideally, we would like to see turns between 2.5 and 3.5. Inventory turns are critical especially when the industry slows down and a dealership’s need for cashflow increases. Of course turns will vary depending on the customer base and seasonality.”
He calls an average fill rate of 82% “pretty good,” but adds, “The discussion I would have around this is what is the fill-rate for stocking parts? In other words, what is it for the parts that a customer expects you to have. He doesn’t expect you to have everything, but this number indicates that 18% of the time, the customer doesn’t leave with what he wanted.
“So it could be better,” he says. “It’s about balancing fill rate and the dealer’s need for cash with overall customer satisfaction.”
To improve these metrics, Russell says, requires the dealership track lost part sales and develop a history to ensure it will have the right parts on hand in the right quantity.
The survey revealed that about 55% of dealers track lost parts sales (Fig. 10). “This usually requires systems that the most sophisticated manufacturers have to help the dealer order parts automatically. I don’t think it’s unusual that 45% of the dealers don’t do this. It takes a lot of discipline,” says Russell.

|
Regarding absorption, Russell says, 53% indicates parts are a significant contributor to covering dealership expenses. At the same time, it can also reflect how well those expenses are kept in check.
Growth Requires Action
Russell says the survey results offer further evidence of the importance of the parts business to farm equipment dealerships. “For the most part, dealerships are running this segment of the business pretty well. But to capture more of it, dealers will need to go out and get it,” says Russell. Simply improving internal operations will not increase a dealer’s parts business significantly.
While dealers appear confident that this area of sales will increase in the year ahead, it’s not going to just come to them. “Dealers need to go after parts sales. It’s not just the farmer’s initiative that will grow this business. It’s something that can be effectively promoted and increased, especially by growing the service labor business. The shop can be a big seller of parts.”