Based on the results of the Western Equipment Dealers Assn.’s 2018 Cost of Doing Business Study, North American farm equipment dealers are making progress in improving a number of metrics typically used to measure their financial performance. At the same time, it’s evident the industry still needs to focus on improving some important operational areas of the business.
For example, on average, dealers saw a slight uptick in total profit from operations and were able to increase their total equity in 2017 vs. 2016. However, inventory turns and total asset turns, which are equally important measures, declined compared to the
previous year(s).
Details of the 2018 study, which represents 2017 dealer financial data, were analyzed by Curt Kleoppel, WEDA’s CFO and president of Equipment Dealer Consulting, and Trent Hummel, consultant and Dealer Institute specialist, during a Farm Equipment webinar in late 2018.
Sales Down, Profits Up
Overall, average North American dealership sales per locations declined by nearly 17% in the 2018 study compared to the 2017 study, or by over $2 million per store, from about $13 million to $11 million. At the same time, total expenses dropped at a slightly higher rate of 18.4%, from slightly over $2 million, or 15.5% of total sales on average, to just under $1.7 million, or 15.2% of sales.

On average, dealers reported lower sales in the 2018 Cost of Doing Business Study than they did in the previous reports, but their data showed they were able to reduce expenses, which improved overall profits. Source: Western Equipment Dealers Assn.
A nearly 31% decrease in interest expense was a significant positive move in the 2018 study. A year earlier, dealers were paying, on average, nearly $100,000 in interest expense, or about 0.76% of sales. This fell to a little over $68,500, or 0.63% of sales. Floorplan interest alone dropped from 0.30% of sales in the 2017 study to 0.15% the next year. In terms of dollars, this represented a decrease from $36,646 to $15,957. As was pointed out in last year’s Farm Equipment report, interest expense “doesn’t make anything run better or look better or it doesn’t improve any company assets. So, we need to minimize it as much as we can.”
Despite the fall off in total sales, results of the 2018 study indicate that dealers were able to make enough adjustments to their operations to produce an average total profit from operations of $114,618, or 1.05% of sales, vs. $77,516 the year prior, which was 0.59% of sales.

On average, dealers’ total expenses in the 2018 study dropped by about 18%. A significant part of the decrease was the result of lower interest expenses, which dropped by nearly 31%, which was 0.63% of sales. This compares with the previous year when interest expense accounted for 0.76% of total sales. Source: Western Equipment Dealers Assn.
“We’re at 1.05%. Ideally, the 2.9% back in 2014 would be a lot better. But the 1.1% is a marked improvement from the 0.6% that we showed in 2017,” says Kleoppel.
Hummel points out that the $30,000 reduction in interest expense is one of the major cost reductions that helped dealers improve profit from operations in 2018. However, he adds that dealers also saw a reduction in building rental of nearly 19%, from an average of nearly $122,000 to slightly less than $100,000 during the year covered by the study. He says he’s not quite sure how this came about.

North American farm equipment dealers were able to reduce overall interest expense in the 2018 study by nearly one-third. Floorplan interest alone dropped from 0.30% of sales in the 2017 study to 0.15% in the 2018 study. Source: Western Equipment Dealers Assn.
What he is sure of, he says, is that “Landlords didn’t come in and renegotiate with dealers because dealers were having some bad years.” He says it’s a possibility, in some cases, dealership owners may have reduced the rents paid by their operating company, which helped improve their profits.
Nonetheless, Hummel adds, while 1.1% was an improvement compared to the previous year, it’s pretty low considering the amount of money invested in the business. “I know the industry target is 3%, but most dealers I work with are shooting for 5%.”

On average, dealers’ profit from operations increased to by 1.1% in the 2018 study vs. 0.59% the year prior. Profit dollars also increased by nearly 48%. Source: Western Equipment Dealers Assn.
Turndown in Turnover
While the Cost of Doing Business Study revealed improvements in several areas, inventory and total asset turns were not among them, according to Kleoppel and Hummel’s analysis. This surpised them.
“I thought the inventory turns would increase from a year ago, but they actually dropped 0.8%. This includes both wholegoods and parts inventory. If you go back to the 2012 study, we had 3.25 inventory turns per year. In the 2018 study it was down to 1.91. I found this to be really quite shocking,” says Kleoppel.
It is estimated that, on average, the inventory ratio is typically 60-70% wholegoods and about 10% parts, or nearly 80% of total assets.
“I view this as very serious,” adds Hummel. “The industry target is 3 and we’re only at 1.9. Not too long ago we were at 3.5 and even 4. I think, at the very minimum, we need to have 4 or 5, and quite likely 6 going forward. You’re just not going to be able to cashflow these organizations with this kind of a turn. You need that money in the bank, you can’t have it sitting in the yard.”
Hummel says 2 turns mean dealers have equipment sitting in their yards for at least 6 months on average before it gets moved. “You know as well as I do, we have stuff sitting there 2, 3 or 4 years. This is really troubling for anybody in the industry that’s trying to figure out how to cashflow their organization.”
According to Kleoppel, larger organizations are aiming for 4 or 5 turns. “We’ve got a long way to go to get there.
“Of course, with inventory turns being down, one would expect total asset turns to be down. The numbers show that it dropped 12% from 2016 to 2017. That’s natural. Inventory comprises about 70-78% of the dealership’s total assets. So if the inventory turns are down, it’s just natural that the total asset turn will be down,” he says.
Idle Assets are Serious Business

The low turns on assets indicates that their usefulness is reduced. In other words, “They’re not making as much money as they should,” says Hummel. “Assets are like cash. You want to use it to make money every day of the year; you just don’t want it to sit in the corner collecting dust. Whether they’re computers or shelves or service trucks or trailers, if you’re not putting them to use and they’re not generating cash, what do you have them for? We either need to increase our revenues or decrease our assets in some form,” says Hummel.
According to Kleoppel, if sales aren’t increasing, then the turns are going to decrease. “Nearly all the balance sheets that I’ve looked at show less total assets than a year ago. But when you look at total sales revenue, it’s just not enough to create an increase in total asset or inventory turns. With most dealers’ used inventory levels down, it makes you wonder if we’re carrying the right inventory and are preorders excessive?“
Maybe the most insidious factor in all of this, adds Hummel, is that not all of a dealer’s assets are paid assets. “Some of them have money out against them, so we’re paying interest on assets that aren’t working hard for us. That’s a real kick in the teeth. You’re not getting as much out of that asset, yet you’re paying the bank loan on it and not generating return off of it.”
Lower Inventory, Higher Equity
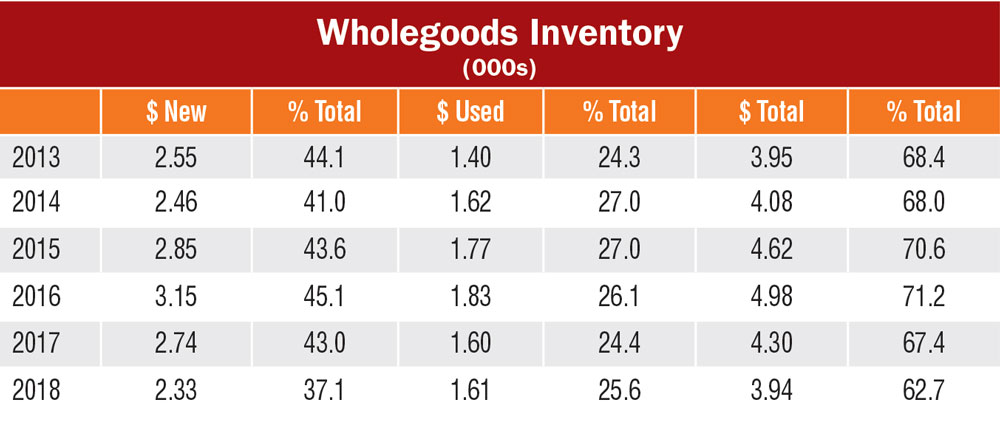
On average, the 2018 study showed that dealers reduced their wholegoods inventory to a little less than $4 million. This is a decrease of a little over 20% from the 2016 study when new and used wholegoods inventory topped out at nearly $5 million per store location. In this newest study, dealers reported an average of $2.33 million in new inventory and $1.61 million in used. In 2016, those numbers were up to $3.15 million in new and $1.83 million in used.
Also, comparing 2016 to 2018, new and used inventory as a percent of total sales declined to 62.7% from 71.2%. This was particularly significant because, as pointed out earlier, the decrease in floorplan interest expense contributed mightily to the dealers’ bottom line. Also, it was used inventories that created the biggest challenge for dealers the past several years.
However, as Kleoppel points out, the 63% number only represents new and used wholegoods. Adding parts inventories to the mix brings the number to nearly 72%, which has been fairly typical over the years.
Nonetheless, dealers were able to decrease total inventories, including parts and other, to about $4.6 million, or 72.8% of sales, from nearly $5 million, 77.5% of the sales. This represented about a 7.5% improvement when compared to the 2017 study.
While the overall inventory reductions are moving dealers back in the right direction, Kleoppel explains, “It still boils down to inventory turns. Some are probably turning inventory a bit more than that 1.91 turn. Still, the overall average of the industry leaves us a lot of room for improvement.”

At the same time, Hummel adds, “I think most dealers would be pretty tickled to be sitting on only $4 million in wholegoods inventory per location. Dealers are cleaning it up pretty well and they’re not reordering new so they don’t have it sitting in their yard,” he says. “Of course their manufacturers aren’t too happy about this.”
Manufacturers’ concerns may center on the dealers reducing their inventories of new machines, but there’s another wrinkle that they may also be keeping an eye on, according to Hummel.
He says dealers have been telling him that they’ve reduced their new inventory because they’re not buying. What they mean, he explains, is they’re not buying from their manufacturer. “They’re buying the lease returns with 300, 400 or 500 hours on them, and they’re buying them in a big way and they’re getting them cheap. While this equipment is used, they’re treating it almost like it’s new inventory. But really, it wasn’t a true tradeoff of a new piece; it was a purchase from outside of the business as a used piece to sell,” he explains.
In essence, at least some dealers have been able to reduce their inventory of new equipment with lower cost newer used machines. In this way they’ve been able to reduce the overall value of their inventory and the associated borrowing expenses.
Another positive coming from all of this, says Kleoppel, is dealers’ total equity percentage (total assets minus total liabilities) increased nearly 6% from the year earlier. “This is a real good sign. We did make some money in 2017 and were able to put that down to our bottom line, so that’s one good positive.
“Back in 2012, the average equity was 28.9%. Now we’re all the way up to 36.4%. Some of this is being driven by the requirements from the manufacturers,” says Kleoppel. “The larger a dealer gets, to make their manufacturers feel warm and fuzzy, they’re increasing their equity percentage. That used to be around 25%. The manufacturers continue to push this toward 30%. That’s one of the reasons why we’re seeing this up a little past the 30% level.”
On average, dealers’ equity increased by approximately $320,000 in the 2018 study, or by slightly less than 6% (36.4% vs. 30.8%). This helped improve net income to $181,216 vs. $174,746 (1.7% vs. 1.3%).
Hummel agrees that it’s most likely manufacturers are demanding owners contribute more of their own cash to the dealership. “They want the owners to have more equity stake in their businesses. It’s not a question of we would like you to, the manufacturer says you will and you have to do it.” He adds that a 6% jump in one year would indicate there’s more outside money coming into the dealership.
In all likelihood, the continuing mergers and acquisitions are also contributing to the increase in dealership equity. Kleoppel explains, “When firms merge, you’re going to see more capital being included in the starting balance sheet of the new organization. You might have two companies that have 25% equity going in, but the requirements to merge together, you’re seeing more capital put in. I think a lot of it is driven through the mergers that are happening.”
Margins: Getting Smarter?
Another positive sign emerging from the 2018 Cost of Doing Business Study is the improving margins on used equipment. On average, dealers reported a margin of 3.9% on used. This is up from 2.5% the year prior and 1.6% in the 2016 study. “We’re either doing a really good job buying our used or we’re taking less margin on new. Or these lease returns that guys are buying, they’re making some serious cash on them and it’s showing up on the bottom line here and it’s showing up in used margins, which is great,” says Hummel.
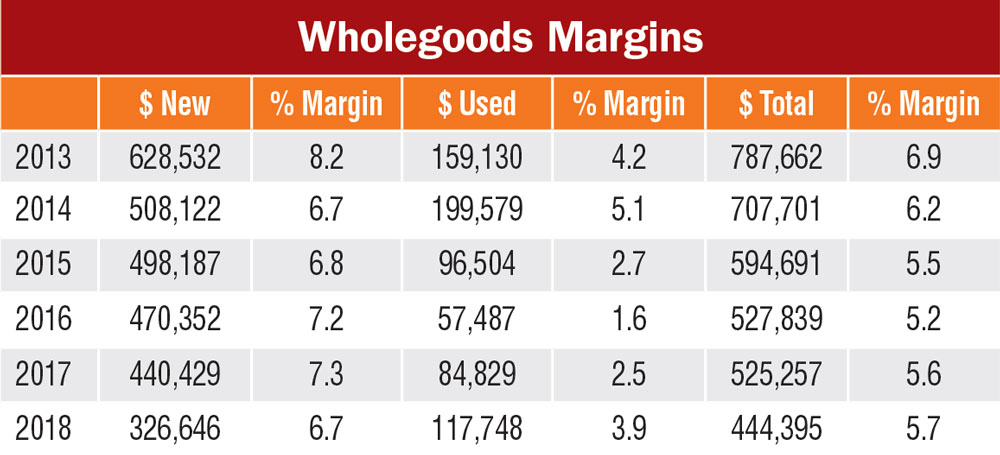
While several factors are contributing to the improved used margins, he believes dealers have gotten a “lot smarter” when buying used equipment. “There are so many options and so many resources to find out what stuff is really worth and what it’s trading for, dealers are making sensible buys on this stuff and making a dollar, so good for them.”
Declining Parts Margins
The drop off in parts sales between the 2017 and 2018 studies is “kind of alarming,” says Kleoppel. While there was almost no change in parts sales in the store mix — 18% in 2017 vs. 17.9% in 2016 — the revenue from parts dropped more than $380,000. This was a drop of 16.4% overall.

On average, there was no real change in margin percent in the newest study — 30% vs. 30.2% the year before, but margin dollars dropped a little over $118,000. “Most dealers are satisfied with the 30% margin,” says Hummel, “but I’m working with a lot of dealers right now who are getting anywhere from 33-35% and even 36% parts margins. If this isn’t moving up, it tells me that there’s still a lot of dealers getting 24%, 25%, 26% and 27%. So the bigger problem, I think, is we’ve got too many parts sold at too low a margin. I see this as a big problem for the industry,” he says.
Service Dollars Slip

In much of the same way as parts, service sales remained relatively stable between the last two Cost of Doing Business studies, but overall service dollars declined by nearly 25%. At the same time, service margins improved by 2.5%.
“I’ve had lots of guys look at this and nobody can figure out how a service shop can drop 25% in one year. It’s not making sense,” says Hummel. “Another problem is the mix. In a true agriculture dealership, the mix should be such that if parts sales are at 18%, service should be at 9%. We’re well under that. In this study, parts are running at 18%, but service is at 6%, so we’re only at a third. I see this as a major problem for dealers.”
Kleoppel wonders if this is a technology issue. “Are we making wholegoods that great to the point there are less parts and service involved? Or are we doing a poor job in managing our parts and service department? Or is it a little bit of both?”
One bright spot is dealers managed to keep service margins at the very healthy level of 62.7% compared to the previous study, which showed margins of 60.2%.
ROA, ROE — Room to Grow
The increased profit from operations reported by dealers produced a positive impact for return on assets and return on equity, as would be expected. On the other hand, both measures have a long way to go to match the levels seen just a few years earlier.

Return on assets (ROA) improved from the 2.61% posted in the 2017 study to 2.86%, but it’s nowhere close to the 8.35% ROA dealers reported in 2014. The industry target for this measure is 6% or higher.
Hummel speculates that the 8%-plus seen 4 years earlier may have been the result of overvalued used inventory. “Looking back, I take some of these numbers with a grain of salt. Some guys were banking their used iron out in the yard which they thought was worth $200,000, it was only worth $170,000 and they just stored it there. Quite often they paid for profits on new pieces that weren’t really actual profits.”
On the other hand, it’s still a positive sign that the industry is gradually making a comeback, but, Hummel adds, “We need to get this back to 6% or better.”
For return on equity (ROE), the analysts point out that it remained stable at 8.5% in the 2018 study compared to 8.6% in the year prior, but the industry target is 20%. So ROE remains way behind the 29.4% dealers reported in the 2014 study.
Dealers need to keep a close eye on ROE, adds Hummel and he admits dealers he works with sometimes get a little irritated with him when he points out that at 8.5%, dealers can do nearly that well by conservatively investing their money in the market and not have to deal with all of the hassle of running an equipment dealership.
“Everybody’s got their own situation. But if you’re not making a good return on your equity, maybe it’s time to think about cashing out and look at what else you do with your money,” say Hummel. “Sometimes we need to honestly ask ourselves, ‘Is my money working as hard as I can make it work? Where else could I put it that it will work hard for me?’”
Holding Headcounts Steady
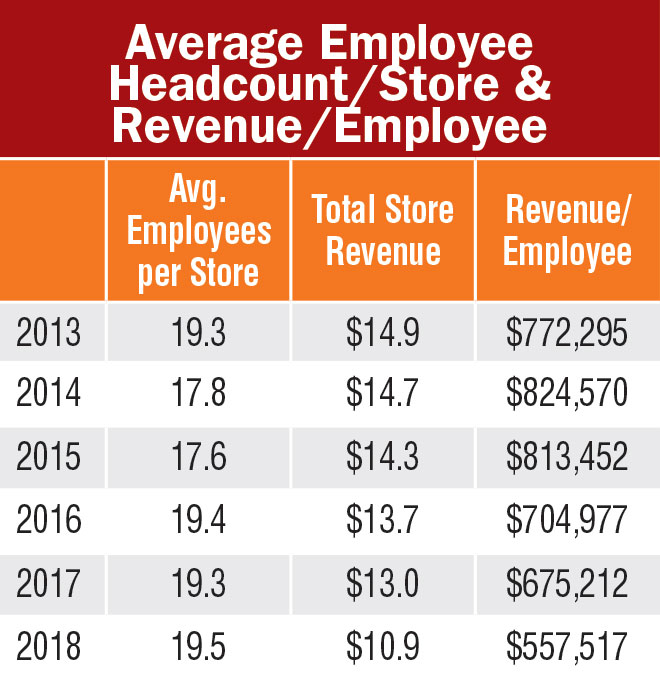
Another key element for improving the bottom line for dealers is employee headcount. The most significant aspect in the 2018 study regarding number of employees is that dealers managed to save some money and improve their bottom line without reducing their headcount. In fact, the average number of employees per dealer location has remained stable in the past three studies. In 2016, on average dealers employed 19.4 people, 19.3 in 2017 and 19.5 in 2018.
During this same period, revenue per employee has declined from about $705,000 in 2016 to $558,000 in 2018.
What Hummel finds surprising in this measurement is, as discussed earlier, overall expenses were reduced, “I thought it would be because of employee reduction, but that didn’t happen.”
He says the sweet spot when it comes to revenue per employee is $1 million each in a big production ag dealership. For dealers focusing on the under 100 horsepower type of equipment, the goal should be $750,000-$800,000 per employee.
“In 2014, with an average of 17.8 employees we were doing $14.6 million per store,” says Hummel. “We were running the boots off our employees. It was so bloody busy, every time you picked up the phone, you sold something. It was a crazy time.”
How to Get and Use the Cost of Doing Business Study
One of the most frequently asked questions from dealers about the Cost of Doing Business Study, which is compiled by the Western Equipment Dealers Assn. annually, is “How can I use this study?”
Curt Kleoppel, WEDA’s CFO and president of Equipment Dealer Consulting, and Trent Hummel, consultant and Dealer Institute specialist, provided an analysis of the 2018 data during a Farm Equipment webinar in late October and took time to answer the question about making effective use of this study and relating it to their own operations.
The first thing Kleoppel makes very clear is that the information presented in the 2018 study is based on dealers’ 2017 financial data. Also, he says, the numbers are averages per dealer location. “If you operate multiple stores, you would multiply the data presented by your number of locations and go from there.”
In the general report, the numbers represent North American averages. This is what’s covered in this Farm Equipment report. To bring the information closer to home, Hummel suggests that dealers order the Cost of Doing Business report for their region. It is also available by sales volume and broken down for stores with $25 million or less, $25-$75 million and more than $75 million in annual sales.
Once you get the report that is best matched to your operation, study the trends and compare them to your own data. “You can then see if you’re trending up or down on the various metrics with the industry,” Hummel explains.
“We know it would be great to be able to look at what the industry is doing right now, but that’s not possible. This is because dealers operate with various year-ends and typically a lot of dealers’ results are not available until April or May. There’s just no way we can provide it on a real-time basis.”
Kleoppel adds, “If you’re trending upward on all these different metrics, you should be having a pretty good year.
“We’re trying to get this data out as quickly as we can to make it as current as possible,” he says. “We’re shooting for the end of July or first of August each year, but we also want to include as many reports as possible, so we often extend the deadline so more dealerships can participate.”
He also points out that dealers who participate in the study can get a free copy of the report from the regional association. Non-participating dealers can purchase the results from their regional groups. Participating dealer associations for the 2018 edition are the Deep South Equipment Dealers Assn., Far West Equipment Dealers Assn., Iowa-Nebraska Equipment Dealers Assn., Northeast Equipment Dealers Assn., United Equipment Dealers Assn. and the Western Equipment Dealers Assn.
For questions or to learn how to access the survey results, please contact Lonnie Finch, DPA, Equipment Dealer Consulting LLC at 800-762-5616 or email him at lfinch@westerneda.com.