Article Updated March 26, 2021
Editor’s Note: This article is a portion of what Mike Hedge presented during his general session to the dealer attendees of the 2015 Dealership Minds Summit. Hedge walked dealers through the importance of concentrating on a few key metrics — vs. the multitude that can overwhelm managers — and how to use them to assess a 50,000-foot view of your business.
One thing I learned a long time ago was not to assume that people who are not accountants understand or have the same level of knowledge when it comes to financial metrics. It’s our job to take this information and make it relevant, and to boil it down to the question, “Why is this important?”
Financial metrics don’t drive our business, but they are a set of guardrails to keep us from running our business off the cliff. And in a cyclical business, when the business goes up and down, it’s easy for those ratios and metrics to get out of kilter. That creates problems for the organization, namely cashflow issues. We’re all encountering one of those cycles right now.
In today’s world, we can be inundated with financial information. My own partners say our people can’t assimilate and organize all the information at our disposal today. The challenge is what to do with it all.
I’d encourage you to know those two to three metrics that you’re going to live and die by. For Birkey’s, over the last 15-20 years, it’s been the leverage of our business and the used inventory turnover — the biggest drivers of a good balance sheet. We work hard on marketing, sales and productivity, of course, but the growth of our business has been sustained through a never-ceasing focus on a healthy balance sheet throughout these growth cycles.
What Balance Sheet Tells You That Income Statement Doesn’t
The source of most metrics are from two financial statements: the balance sheet and the income statement. Most people throughout our dealerships are familiar with the income statement, but not the balance sheet.
Income Statement: With the majority of management personnel coming out of sales, it is natural for many leaders to gravitate to the income statement. It measures sales performance and it’s lively and fast and you see the profit and loss each month.
The income statement provides us only with a perspective of the profitability of a business. It gives us immediate feedback about current sales performance, but it doesn’t tell the whole picture about the company’s financial health and, by itself, can be misleading because it doesn’t report on the assets, the liabilities or the equity or cash movements.
Here’s why: you can create an income stream and a net income in a business, yet still be insolvent. We stress this with our leadership group. We know solvency issues are what cause dealers to be taken out of the game, more so than profit issues. Solvency is critical in a cyclical business. We must understand what cash means to our organization and manage for it.
Balance Sheet: The balance sheet is a different animal. It’s much slower moving and doesn’t get the adrenaline pumping like watching sales. But, keeping it healthy allows you to pursue opportunities without jeopardizing the health and stability of your organization.
Years ago when we moved toward an open book management philosophy and were looking for some source material for our managers, we came across Thomas Ittelson’s book, Financial Statements: A Step-By-Step Guide to Understanding and Creating Financial Reports. I’d encourage you to pick up a copy if you’re looking for additional general information about financial statements that’s easily understandable. Much of the information and terminology I use in explaining basics of the balance sheet and income statement in layman’s terms comes from his material.
Ittleson, in his book, presents a rearranged form and explanation of the balance sheet that I find extremely helpful when we discuss leverage and how the business is financed with our departmental and store managers. It is rearranged so that it appears as:
Assets (what we have) = Liabilities (what we owe) + Equity (what we own)
When you rearrange it this way, you can begin to see that everything the company has is financed by one of two sources — money owed to others or through money that we “own” — through the owners’ investment in the company. This is important as we talk about leverage and the level of risk in an organization for those helping finance the business.
The balance sheet presents the financial picture of a company on a single day — its assets, liabilities and equities.
Figure 1 shows the contents of the balance sheet, including the assets in the business — cash, our receivables, inventory, pre-paids, fixed assets. The things that we owe are payables, floor plan notes, short-term borrowings and long-term debt. And then there’s the equity, or the capital that owners put in. It also includes the money owners choose to leave in the business through retained earnings.
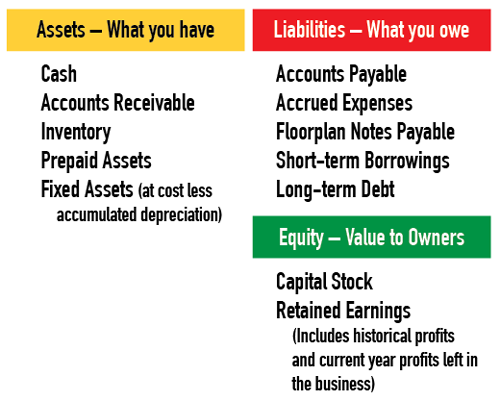
Fig. 1. Presented are the contents of the balance sheet in the rearranged format that structures the equation of Assets (what we have) = Liabilities (what we owe) + Equity (what we own) to more clearly recognize how the enterprise is financed.
If we want to be a growing business in the future, some of those earnings must be reinvested. A strong capital base is what allows us to move the business forward and to reinvest in facilities, trucks and technology. The farm equipment business requires reinvestment if we’re going to be in it for the long haul.
Giving your balance sheet the same attention as the income statement pays dividends in the long term. Most of the metrics that measure the overall health of our business are calculated from information that comes out of a combination of both the income statement and the balance sheet. We stress how it all fits together with our leadership groups. We say, “Let’s understand how we manage the balance sheet because it sets the stage for you to go out and achieve those sales and profit goals, and to bring the return to your store.”
In our business, when the market is growing and expanding, we tend to be full speed ahead with driving our sales and focusing on the income statement. But when we get in those times when the business is retracting, our focus shifts. Cash is always king, but the focus on the balance sheet and, more specifically, the inventory will provide the cashflow to sustain us through these slow markets.
Leverage
Leverage
Measures: How well the business is capitalized and the relationship of internal vs. external financing that’s supporting the assets of the company.
Why It’s Important: It measures the financial stability of the business and measures the quality and source of financing of the company’s assets.
Presented in Two Ways: Financial Leverage (assets divided by equity) and Debt-to-Equity (liabilities divided by equity).
Leverage measures how well our businesses are capitalized and what kind of a relationship we have between the internal and external financing that helps support those assets. It’s important because it helps us understand whether the business is adequately capitalized to 1) carry the amount of assets on the books, and 2) to support the sales that these assets generate. Interestingly, a lot of people don’t fully monitor what their leverage is in the business.
In the slower and more difficult times, maintaining strong leverage ratios will keep our lenders engaged. We want them to know we’re managing leverage in both good and challenging times; and we certainly need them now as much as we ever have. They need to be confident and comfortable, as they extend that credit, in knowing we will be engaged in managing the leverage and managing their risk in funding us.
We track it both via “financial leverage” and “debt-to-equity.” In our business at Birkey’s, leverage is key to our growing the business at a steady pace as we have borrowed funds for each acquisition and then worked it down to a healthy level before pursuing the next one.
Your financial leverage is a ratio that shows how many dollars of assets you have for each dollar of equity the owners have invested in the company.
The second leverage ratio we look at is debt-to-equity, a ratio that’s often easier for the non-accountant to understand. This ratio looks at the relationship of liabilities to equity, and tells us what the ratio is of outside money vs. owner money being used to finance the assets of the business. A debt-to-equity of 2.0 means the business is financing assets with $2 of debt for every $1 of investment from the owner.
Mathematically, there’s always a 1 point difference between the financial leverage and the debt-to-equity; debt-to-equity is always 1 less.
Case in Point: Leverage
Figure 2 shows two dealerships with equal owner’s equity of $3 million. In Dealer A, you see a dealership with $9 million in assets, of which $6 million is financed through a floor plan or some kind of a bank line. With the owners’ $3 million of equity, the financial leverage is 3 and the debt-to-equity is 2, so the liabilities divided by the equity is 2. Again, this means that the business is financing its assets with $2 of debt for every $1 of investment from the owner.

Figure 2. These two examples of leverage show how two dealers can have the same amount of equity, but vastly different asset and liability pictures.
Dealer A’s banks have loaned this business $2 for every $1 that the owners have invested. Dealer B is counting on the banks to lend the business $4 for each $1 that’s invested in the business. In other words, Dealer B is asking an outsider to lend twice as much for the same amount of business and equity as Dealer A. Banks are nervous about that in times when we have these cyclical downturns that inevitably happen. Either they’re not quite as interested in lending the money, or they want to raise their interest rate.Dealer B could be the same dealership managing their inventory turns differently. It has $15 million in assets, $12 million liabilities and the same $3 million in equity. Its financial leverage is then 5 and its debt to equity is 4.
So being proactive and taking the initiative on leverage is critical for maintaining the health of our business. Banks will be much more likely to ride it out with you if you’re Dealer A.
Inventory Drives Leverage
So what’s the biggest driver of leverage in our dealership and what can we manage? Inventory.
As a high horsepower dealership, our inventory can be up to 75% of our assets, and that makes inventory turnover (how often you sell through your inventory in a year) key to managing the health of our business, to managing the leverage.
While store managers and salespeople understand the concept of inventory turns, it comes as no surprise that some don’t know how it’s calculated. But we all better know how to calculate it because if we don’t, we’ll miss the opportunity to affect what will have the biggest impact on the leverage of the entire dealership.
Inventory turnover is the number of times you can sell through your inventory in a year. In its simplest example, if you sell 4 units in a year while averaging just 1 unit in stock, your turnover is 4.
Inventory Turnover
Measures: Inventory turnover is the number of times you can sell through your inventory in a year.
Why It’s Important: Turnover equates to solvency, which equates to cashflow.
How It’s Calculated: Cost of sales for last 12 months divided by the average inventory for last 12 months.
To calculate it, you take the cost of sales over the last 12 months and divide that by your average inventory over the last 12 months. The rolling 12-month statement provides us the basis each month for the prior 12 months and should be something that every dealership works from.
We ask our store managers, “Where’s your cost of sales going to be this month compared to the same month last year? Is that going to increase that numerator in the equation? What is your inventory going to be compared to where it was last year?”
We want to continue to drive and direct their efforts toward selling activities that not only manage sales and gross margins, but also help drive turnover.
Consistent, Quality Info is Key
One of the challenges we’ve seen in acquiring other dealerships has just been the lack of consistency of information — things like predictable and standardized monthly cutoffs, similar accounting treatments across each transaction and reporting packages that present the trends and ratios. The quality of the information dealers have is all over the board. Sadly, too many have poor information, or if they have it, too often they are using only a small part of it in their decision-making.
If we want to analyze and make decisions using financial metrics, we must make the investment to create high-quality reporting on a consistent basis.
It’s important to the business because turnover basically drives solvency, which equals cashflow. We spend a lot of time on solvency when we share information with managers. Solvency simply means we have enough money to pay the bills as they come in. It’s not any more difficult than that. So we need the turnover that creates solvency — the cashflow — to allow the business to pay the bills.
Probably the biggest drag on solvency in this business is slow-moving inventory; continuing to carry that equipment that we aren’t turning into cash. If we’re selling a new combine, it could be 2.5 years before we wash out of the fourth or fifth unit. Now, if we’re really on top of our game, maybe we got the first or second one pre-sold and so we’re down to that third trade. Still, the cycle to turn that into cash takes time.
In today’s market, all of our manufacturers want us to continue to raise market share. They want us to continue to sell new equipment, and we want to do that too, but we want to raise new market share and used market share at the same rate or it doesn’t work.
So when we get into a downcycle and try to continue to grow the new business, the issue of turnover and cashflow is more difficult. We as dealers must make difficult decisions about how much inventory to bring in. In our business, we have more than 400 families that are depending on us to be prudent with our financial decisions and our cashflow, so sometimes we must make long-term decisions to pull back, which aren’t always popular.
“You can create a net income, yet still be insolvent. Solvency issues are what cause dealers to be taken out of the game, more so than profit issues...”
Case in Point: Turnover
Figure 3 shows the same example shared in the “Case in Point: Leverage” example. Let’s say that both dealerships are generating the same $25.3 million of sales at a 5% gross margin.
In Dealer A, assume that inventory is $6 million and the turnover is 4.0, while for Dealer B, the $12 million in inventory results in a turnover of 2.0. So Dealer B has $6 million more tied up in inventory, which will put pressure on either free cashflow or the borrowing capacity of the business. It has significantly more solvency risk, and cannot invest in things that will generate more cashflow in the future because it’s tied up in inventory that’s not moving.
Dealer B has to carry $12 million in inventory to get the same job done as Dealer A that’s turning it 4.0 times. Dealer B is investing in a lot of assets, and borrowing a lot of money to end up with the same result.
Meanwhile, Dealer A, with a 4.0 inventory turns and debt-to-equity ratio of 2.0, can grow the business. It can take that free cashflow and borrowing capability to go and invest in another dealership, or take it to invest in computers, trucks and facilities.
Plus, these examples probably don’t portray the losses in margin that Dealer B will likely face due to the costs associated with aged inventory — things like weathering, writedowns, additional cleanup and reconditioning costs, not to mention interest costs, lot maintenance and additional insurance for inventory.
Because it’s had inventory sitting for so long, Dealer B will have units that must go to wholesale and auctions, and take losses on it. Their margins probably aren’t going to be anywhere near the higher turning dealer.
Benchmark Against Yourself & Engage
We as dealers shouldn’t need consultants to tell us what our metrics should be; most of us have years of data right now.
Our dealerships are so diverse from large horsepower to small dealers from different regions of the country, that the right ratios for us may be totally wrong for another dealership. But, the investment in understanding these numbers and how it applies to our own dealerships is well spent.
You know when times were good and things were working best. If you invest the time to look at the history of this data and the ratios it creates, you can create a benchmark of your own.

Fig. 3. Showing the same two dealerships as in Fig. 2, this shows how inventory turns can be different for the dealers at the same sales volume.
And if you’ve got multiple stores, you’ve got a wealth of data to compare store vs. store right now. If you’ve got the metrics, if you calculate them regularly and consistently, you can take that information and drill down into those stores that are performing well and use that information with your non-performers to make changes.
Frankly, we’ve got to trust our people with information and engage them in the financial management of our dealerships. In our business, we’ve chosen to be “open book” with parts managers, service managers, salesmen, office managers and store managers. They know the numbers of our business; they see it all.
We find that change is easier if they know the whys all along. When we’ve got to make a decision to pull back our wholegoods purchases, to wholesale a piece of equipment or make a sale that doesn’t generate a margin, we can explain that, “It’s a decision to manage our turnover,” and they know why we must do it. And they’re much more likely to buy into that if you’ve brought them along and engaged them in the process. And empower them to make decisions from information.
Related Content
- Tracking New vs. Used Mix: Birkey’s Farm Store President/CEO Mike Hedge elaborates on the importance of monitoring sales mixes in wholegoods.
- Monitoring Service Tech Productivity: Birkey’s Farm Store President/CEO Mike Hedge discusses service productivity issues and the high cost of unapplied labor most farm equipment dealerships experience. And he encourages dealers to start looking at service techs through a lens of inventory units.
- Can Parts Turns Be Too High? Birkey’s Farm Store President/CEO Mike Hedge explains the balance that dealerships must find between parts turnover and customer satisfaction.
- Navigating the Numbers for Growth (CFO Focus): While many dealers dream about achieving the financial stability of Birkey’s Farm Store, the company didn’t get there without enduring some pains of its own.