Any farm equipment dealer who’s been around more than a few years knows how dramatically this business has changed. For one thing, everything about agriculture seems to have gotten bigger: bigger dealers with bigger sales territories; bigger customers with bigger demands; bigger and more expensive equipment; bigger top and bottom lines.
But when all is said and done, how much has the business of selling and servicing farm machinery really changed over the past 4 decades or so? Or, more importantly, is our business performance improving enough to keep us competitive and profitable now and well into the future?
To get a measure of how current industry performance stacks up compared to how it was doing starting in 1970, Farm Equipment editors compiled 40-plus years of data from the annual “Cost of Doing Business” study (CODB) that has been undertaken since 1947 by various dealer groups. This required the help from the newly formed Western Equipment Dealers Assn. (WEDA), Mid-America Equipment Retailers Assn. and Ohio-Michigan Equipment Dealers Assn.
Starting with the National Retail Farm Equipment Assn., over the years the “Cost of Doing Business Study” had been handed off to the North American Equipment Dealers Assn., then the SouthWestern Assn., and now to the Western Equipment Dealers Assn., which was formed last year through a merger of the SouthWestern Assn. and Canada West Dealers Assn.
The changing of the guard probably accounts for some of the inconsistency found in the data over the years. This along with the shifting business environment of the industry during the past 44 years may also explain the varying emphasis on different metrics over time. In any case, some data is absent during certain years, but enough existed to identify how the industry has or hasn’t changed during the past 4 decades.
Click to enlarge
Most of the data presented in this report is shown in 5-year increments from 1970-2014 to illustrate general trends over nearly 4.5 decades. In some cases, to fill in data that was incomplete for certain years, we’ve had to utilize data from the following year. For example, this was the case for 2010 where, in several instances, due to lack of data, 2011 information was substituted to fill in the blanks. Despite these inconsistencies, over time the overall trends are valid and readily apparent.

David L. Kahler, Retired CEO, Ohio-Michigan Equipment Dealers Assn., Dublin, Ohio
For the last 45 years of his career, Kahler has served farm equipment dealers. He spent 22 years as the CEO of the Ohio-Michigan Equipment Dealers Assn. and was an active industry participant who earned the respect both of dealers and manufacturers. Kahler retired from full-time employment in 2008, but still works part-time as the associate director for AMG LLC, which represents dealers in Indiana and Kentucky, as well as Ohio and Michigan.

John R. Walker, President, After Market Services Consulting Co., Ft. Mill, S.C.
Often called the guru of parts and service, Walker’s area of expertise is the equipment dealers’ product support and how to increase product support sales and profit. In the farm equipment industry, Walker has worked with every major line manufacturer over the last 36 years, as well as many shortline manufacturers and scores of farm equipment dealers. He also has published over 100 manuals covering “how to” techniques for capturing aftermarket opportunities and has written over 300 articles for trade and association magazines on the subject.

Ron Birkey, Chairman, Retired CEO & President, Birkey’s Farm Store, Illinois and Indiana
Birkey began his career in the farm equipment industry after college when he joined International Harvester as a sales manager for an Iowa territory, before returning to Birkey’s Farm Store. He retired from the dealership in 2012 after 35 years with dealership group, 12 of which were spent serving as president and CEO. When he joined Birkey’s in 1977, the dealership had 2 locations. Today, the dealership has 13 retail locations spread across two states.
Following compilation of the data, we then turned to three farm equipment veterans and students of the industry to review the numbers and give us their assessment of where the industry stands now vs. then. They included David Kahler, the long-time CEO of the Ohio-Michigan Dealers Assn.; Ron Birkey, chairman and retired president and CEO of Birkey’s Farm Store; and John Walker, president of After Market Services Consulting Co., a 36-year old consulting company based in Fort Mill, S.C.
Following is a rundown of the financial indicators and operational trends of the retail side of the farm equipment business. It also includes the panelists’ insight and observations.
Sales & Income Trends
The average sales figures per dealer presented in the CODB studies are likely much lower than the industry’s actual average sales (CODB reported average sales for all participating dealers to be $592,000 in 1970 and $14.7 million in 2014). It’s the difference between sales at the beginning and end of the period studied (approx. 25x larger in 2014 v. 1970) that is the better indicator of how business levels have grown for North American farm equipment dealers over the years.
Escalating prices for new ag machinery, consolidation of dealers along with the agricultural boom of the past decade produced major changes in how dealers do business today vs. 40 years ago. But, then again, so did the farm crisis of the 1980s. When comparing one era to the next, we need to take these business-changing events into consideration.
Birkey adds, “It’s interesting to see the change in numbers, a lot of which is related to inflation. But they also compare businesses that covered a much smaller territory. I would guess that there were 7-10 times the number of dealers in the areas covered by a single dealer today. Also, headcounts have increased as dealerships have covered larger territories.”
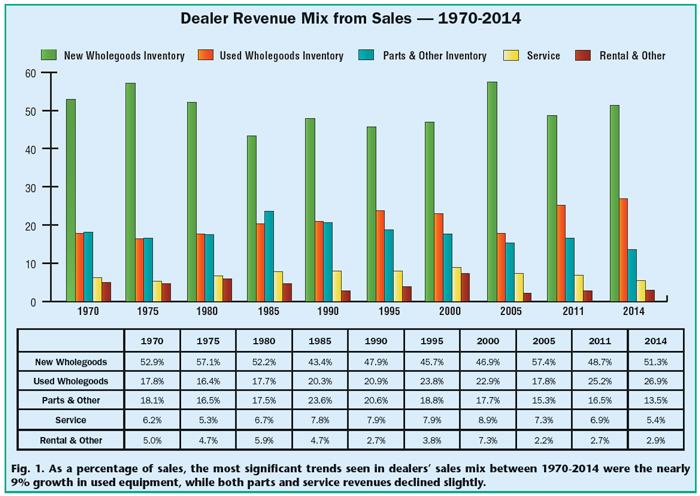
Sales Mix Trends. What’s more pertinent than overall sales growth is the change or lack of change in dealers’ sales mix during this period. The most significant shifts would seem to be in the increased sales of used wholegoods and the stagnant level of revenues from service as a percentage of total sales.
Between 1970 and 2014, the percentage of revenue from new wholegoods sales ranged from a low of 43.4% of sales in 1985 to highs of 57.1% in 1975 and 57.4% in 2005 (Fig. 1). Otherwise, the difference from 1970 (52.9%) to 2014 (51.3%) is almost negligible.
On the other hand, with few exceptions, revenues from used equipment as a percentage of total sales show almost continued growth during the past 4.5 decades. Starting at about 18% in 1970, by 2014 the percentage of total revenue from used equipment sales grew to nearly 27%, a gain of almost 9%. The exceptions came in 1975, when used equipment sales dipped to 16.4% and in 2005, when they fell to 17.8%. Not surprisingly, these are the same years when new equipment sales as a percentage of total revenue reached its zenith.
During this 44 year span, the percentage of sales from parts and accessories started off at 18.1% of total sales in 1970 and peaked in 1985 at 23.6%. From there, sales in this segment declined and reached a low 13.5% in 2014.
Revenue from the service segment as a percentage of total sales experienced a similar trend. Starting off at 6.2% in 1970, service revenue reached its apex in 1985 at almost 8% of total sales. It has declined since, hitting its lowest point of just 5.4% in 2014.
Kahler observes that, “Sales mix on new remains constant, while the used wholegoods has increased by 50%. Parts and service mix is actually lower today than it was in the ‘70s. This does not bode well for the all-important absorption rate. It truly puzzles me why more dealers do not go after the aftermarket sales of parts and service with dedicated employees that sell only those items.”
Click to enlarge
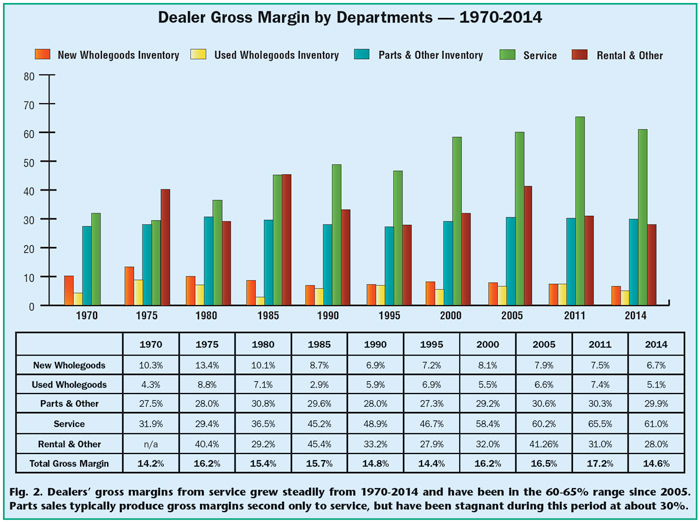
Tracking Gross Margins. Despite representing the smallest percentage of total sales among the major dealership revenue-producing segments, service easily produces the highest gross margins (Fig. 2). Between 1970-2014, margins from the sales of service have steadily increased from nearly 32% in the first year of the survey period to a peak of more than 65% in the period around 2010. Since then, it has declined slightly to about 61%.
Sales of parts and accessories traditionally produce gross margins second only to service. But unlike service, which has experienced a considerable improvement in margins, parts sales have remained relatively stagnant during the course of the study period. Very little variance can be seen on either side of 30%, with a high of nearly 31% in 1980 and a low of 27.3% in 1995.
For new wholegoods, other than a couple of blips where gross margins came in with double digits between 1970-80, on average, margins on new machinery have hovered in the 7-8% range and have trended downward consistently since 2000, with the lowest recorded in 2014 at 6.7%.
Overall, as a business segment, the lowest margins over the past 44 years have been recorded for used wholegoods. The highest average margin shown in the CODB studies occurred in the 1975 period (8.8%) and the lowest in 1985 (2.9%).
Overall ag equipment gross margins have ranged from 14.2% in 1970 to a high of 17.2% in the period around 2010. Data from the most recent CODB study showed an average total gross margin of 14.6% in 2014.
“Gross margins on new have dropped over the years to a number that is just not acceptable; 6.7% is way too low,” says Kahler.
“Gross margins on new have dropped over the years to a number that is just not acceptable; 6.7% is way too low…”
“With the multi-store operations of today and the larger AOR’s, you would think some of the in-line competition would diminish. Maybe brand competition is still too strong to allow for larger margins. Gross margins on used has remained the same over all the years — still not strong at 5%. What is impressive is that parts gross margins have remained strong at 30% while service gross margins have doubled in 44 years. That is a very strong statement.”
Monitoring Inventory Trends
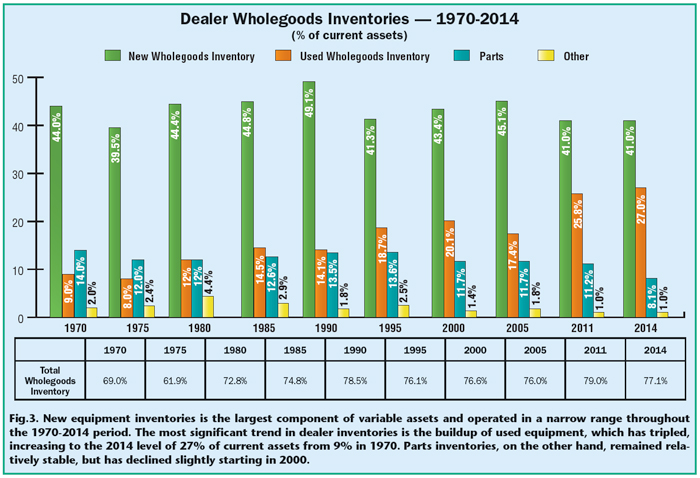
The largest components of a dealership’s variable assets are its equipment inventories, including new and used wholegoods, parts, rental and other inventories. As a percent of total current assets during the timeframe of this project, dealers’ equipment inventories have ranged from a low of 62% to a high of 79%. Since 1985, equipment inventories have remained in the mid- to high-70% range (Fig. 3).
Other dealer current assets (Fig. 4), including cash, accounts receivable and other, have seen a distinct downward trend since 2005. Prior to that they were, for the most part, relatively steady. Except for 1975, other assets hovered in the teens. Since 2005, they have remained in single digit territy, hitting a low of 3.4% in 2014.
New Equipment Inventories. According to data from the CODB studies, from 1970-2014, average new equipment inventories as a percent of current assets, operated in a narrow range throughout the period. From 44% in 1970 to 41% in 2014, the peak for new equipment inventories was 49.1% in 1990 and the low was 39.5% in 1975.
Commenting on this data, Kahler said, “It is interesting to see how new wholegoods has remained relatively constant over the 44 years, but dropping somewhat in the last 24 years. This is due to the fact that today’s equipment is so ‘option’ driven, dealers can no longer inventory one of everything. A lot of equipment today is almost on a ‘build to order’ basis.”
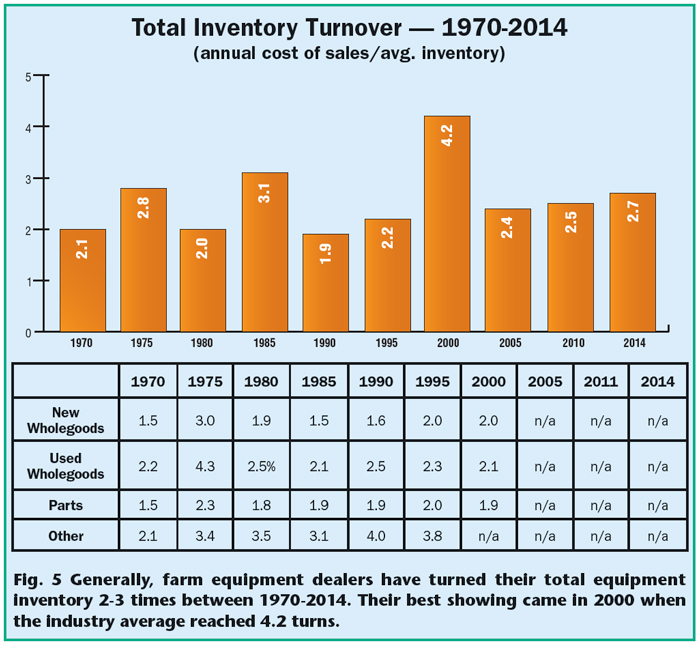
Data on turnover for new wholegoods during this period only appears in the CODB studies through 2000. For 2005 through 2014, (Fig. 5) only data on overall inventory turns is provided. Nonetheless, for the years where specific data is available, on average, farm equipment dealers only reached the industry benchmark of 2.5-3 turns for new machinery in 1975 (2.9x). Otherwise, the farm equipment business generally operated in an average range of 1.5-2 turns on a yearly basis for all new wholegood products.
Used Equipment Inventories. Unlike the steadiness of new, used equipment backlogs grew significantly over this period. Starting in 1970, when the industry’s average used inventories were 9% of current assets, this percentage tripled to an average level of 27% of current by 2014.
Click to enlarge

Click to enlarge
“It was interesting that used inventory has risen quite a bit as a percentage of total inventory since 1970,” says Birkey. “However, used equipment that was farmed with back in 1970 was not that old. Technology had evolved rapidly in the prior 25 years and the older equipment was not used as much at that time.
“Today, we still see 50-plus year old equipment being used every day on the farm. So used equipment inventory and corresponding used equipment sales represent a larger percentage in total sales in 2014. There are still a lot of old workhorses being used today.”
Click to enlarge
In his 40-plus years working with dealers, Kahler says this significant growth of used equipment inventories as a percentage of total assets is worrisome. “The tripling of used inventories concerns me because the dealers’ profits are often tied up in their used inventory. The next question is what is the true ‘net worth’ of the used inventory? Is it what the dealer believes it’s worth or what he actually sells it for?”
According to CODB data, on average, the industry has operated in the general range of 2-2.5 turns for used wholegoods. The peak occurred in 1975, when the average turn rate reached a healthy 4.3 times.
“This is probably the most critical metric for an equipment dealership,” says Birkey. “If poorly managed, it will bury most dealers in bad times. Ideally, you need to turn used equipment every 90 days or 4 times a year. This is very difficult to do because most dealers aren’t focused on it as their number one priority.”
Parts Inventory. The industry’s average parts inventories, as a percentage of current assets, declined somewhat throughout the span of the years included in this report. For the most part, it varied by only about 2% until 2005. Since then, it has declined, with the low of 8.1% coming in 2014.
Between 1970 and 2000, the average turnover of parts inventories reached or exceeded 2 only twice, in 1975 (2.3x) and 1995 (2x). Otherwise, 1.8x or 1.9x is the best the industry could muster on average.
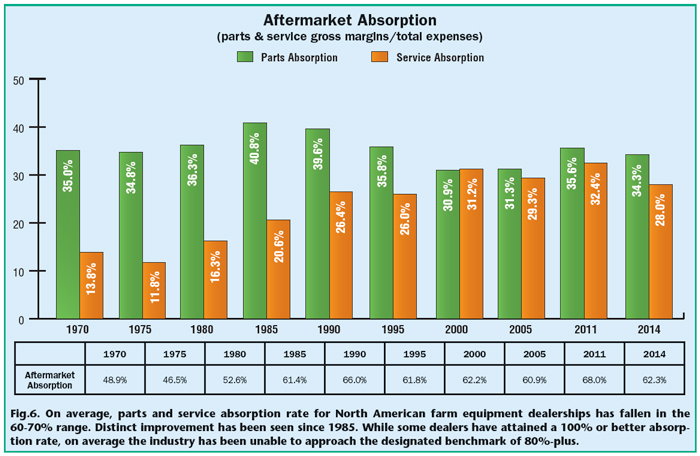
Parts & Service Absorption
One of the key indicators that many, but not all, dealers use to measure their performance is absorption rate. Generally, absorption measures the capacity of a dealership to operate profitably without ever selling any wholegoods. Absorption rate is typically calculated by taking total gross profit from the sale of parts and labor, which is sales minus the cost of parts and labor sales and dividing that total by the dealership’s fixed expenses.
“In regard to absorption,” says Birkey, “all efforts that maximize your market share of parts and service business are critical. You have to get the lion’s share of the business in your area to be successful. Focusing only on wholegoods is a prescription for disaster in today’s business. Achieving the highest possible level of absorption is vital.”
While some farm equipment dealerships have managed to attain a 100% or better absorption rate, on average, as an industry, between 60-70% is more typical (Fig. 6). According to the CODB data, the benchmark 80%-plus is what dealers should be aiming for.
As a group, the highest rate North American farm equipment dealers attained during the 44 years that were examined was 68% in 2011. In 2014, dealers reported an average 62.3% average absorption rate.
In the early years, parts absorption of 35% or 40% was double or triple the rate achieved in the service department. More recently, aftermarket absorption from parts has declined somewhat, while the service absorption rate has risen. Despite this trend, there has been no discernible improvement overall as an industry since the early 1990s.
If there is one segment of the farm equipment retail business where John Walker believes dealers are leaving money on the table, it’s in the service department. “If farm equipment dealers are looking for additional income, the first place they should look is in service,” he says.
Click to enlarge
Using the CODB numbers, Walker, who is the president of After Market Services Consulting Co., points to the service contribution of 5.4%, which is the lowest of any of a dealership’s four major profit centers, but which has an average gross margin of 60%-plus, which is the highest in a dealership. “I work with dealerships that are getting gross margins of 71%,” Walker says.
“Looking at the numbers, it’s obvious that dealers are selling more than twice the dollars in parts than what they are selling in service,” he adds. “Would there be the possibility that maybe your parts department is selling parts to independent shops, the will-fitters and, yes, to customers who are doing their own service?”
On top of it, Walker says, looking at the numbers also shows that, “In the good years, when sales are ‘hot and heavy’ there will be a movement downward for service contribution and also for parts.”
Service Market Share: As much as he doesn’t like using the term market share, Walker says he has been able to convince several companies of its necessity. “It is the only way to measure and determine a dealership’s ‘unknown opportunity.’
“Caterpillar has recently begun this process and they have told their dealers that they estimate CAT globally is leaving $18 billion on the table in lost product support sales. Can you imagine what if each dealer get’s his share of this unknown opportunity what would happen to CAT dealer’s absorption rate, particularly when it’s already running well over 100%?”
Service market share is measured by dividing the number of equipment buying customers who are having their equipment serviced by the dealership by the total number of equipment buying customers. For example, if a dealer has 1,000 customers who are buy equipment from the dealership, but only 300 of those customers are using the dealer’s service department, then the dealer has service market share of 30%. “For some dealers, this might be acceptable. But the reverse of this is that the dealer has a 70% ‘unrecognized opportunity’ to feed his cashflow and increase his absorption rate,” explains Walker.
“World-class equipment dealers are those who achieve high AR figures — 100%-plus — and high customer satisfaction indexes. They are dealers who truly market the full services of the dealership and because of this they are assured to have high product market share, as well,” he says. “There are many dealers who meet the market share standards of the manufacturer, but fail to recognize or acknowledge that there are ways to increase their profits dramatically and at the same time achieve market share.”
“Dealers with a service market share of 30% also have 70% of unrecognized opportunity to improve their cashflow…”
He says surveys of farmers showed that the number one reason why dealers don’t get more of their service business was because they don’t ask for it.
Personnel & Performance
While the average number of employees per dealership during the period of 1970-2014 (ranging between 13-20) isn’t truly indicative of the industry, particularly in the past decade, the employee mix by department and sales per employee are better indicators of industry trends.
On average, the service department has employed between 43% to nearly 50% of all employees per dealership. Over the years studied, 47.2% of the dealership’s total employment worked in the service department (Fig. 7).
“If you don’t have 40-50% of your people in service, it’s very difficult to become successful in the bigger picture, because service drives customer loyalty and establishes the need for you as an entity in his marketplace,” says Birkey. “A quality service department can provide the best value for the customer compared to any other part of your dealership. So, if you’re not getting your lions share of that and working hard to get it, I don’t know how you can be successful. You just become another business that brings very little value to the customer other than a cheap price.”

Click to enlarge
Between 1970-2000, sales personnel made up between 21-23% of employment rolls, but since 2005, the average number of salespeople per dealership has declined to between 16-17% of dealers’ payroll. Averaged across the 44 years, 20.5% of all dealership employees worked in sales.
The average number of people in the parts department at farm equipment dealerships generally was 15-20% of the total number of employees. Up until 2005, the average number of parts people came in a little less than those in the sales force. Starting that year, dealerships’ parts departments have edged out salespeople and ranged between 18-20%. Over the span of the last 4.5 decades, the parts department has averaged 17.7% of dealers’ total payroll.

Click to enlarge
Employees categorized as “other” have comprised between 11% to nearly 16% of dealer employee rolls over the same period. Annually, 14.6% of dealer employees fell into the “other” category.
Sales Per Employee. On an average sales per employee basis, North American farm equipment dealerships have experienced continuous, and in some cases remarkable, increases. In 1970, each dealership’s employees averaged $60,300 in overall sales. By 2014, this had increased to nearly $825,000 in average sales dollars for each employee. On an average basis, sales per employee increased by nearly 14 times from 1970 to 2014 (Fig. 8).
In 2000, the gross margin per employee was $53,700. This has grown to a gross margin per employee of $71,700 in 2005, $87,600 in 2010 and $120,500 in 2014.
Other Key Indicators
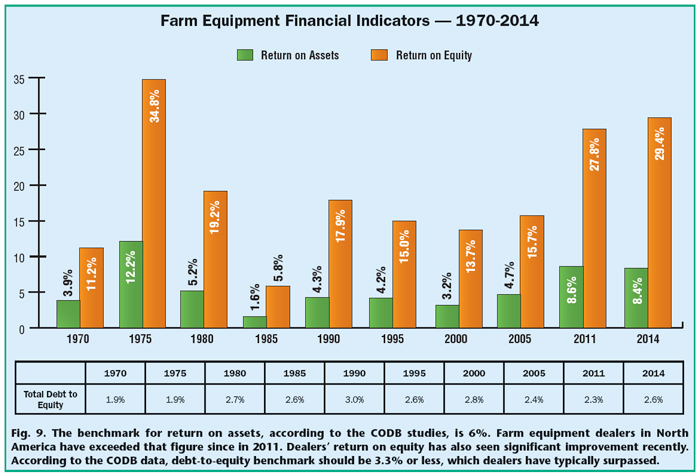
In addition to inventory turnover, aftermarket absorption and sales per employee (or gross margin per employee), other financial and operating indicators highlighted by the CODB studies over the years included return on assets (ROA), return on equity (ROE) and debt-to-equity ratio (Fig.9).
Return on Assets. According to the CODB reports, the ROA benchmark that dealers should be targeting is 6%. It is defined as net income before taxes divided by average assets. Only in recent years have North American farm equipment dealers surpassed the benchmark number.
After hitting an average ROA of 12.2% in 1975, the closest the industry came to hitting the benchmark 6% was in 2005, when it reached 4.7%. Since that point, the industry average easily exceeded the benchmark, reaching 8.6% in 2011 and 8.4% in 2014.
Return on Equity. While CODB doesn’t indicate a benchmark for ROE, the industry trend pretty much set the same pattern that was seen in average ROA. The highest ROE that farm equipment dealers posted in the 1970-2014 period came in 1975, hitting 34.8%. Strong numbers we then seen again in 2011 (27.8%) and 2014 (29.4%).
Click to enlarge
Debt-to-Equity Ratio. Calculated in CODB as total liabilities divided by total net worth, the industry benchmark is 3.3% or less. According to CODB data, on average the only year that the industry approached the benchmark number was in 1990, when the industry average was 3%. Otherwise, the average for the 10 years studied was 2.48%.
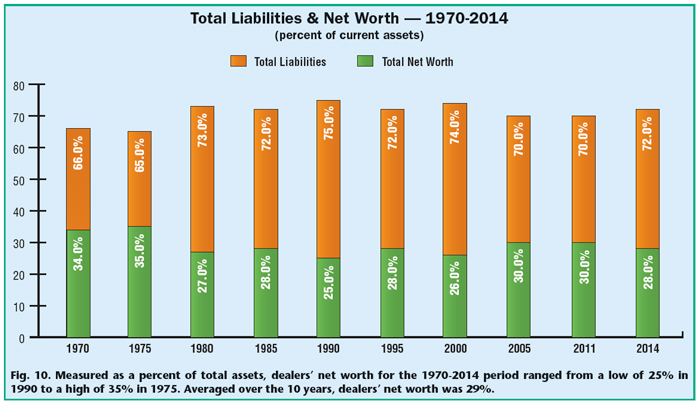
Dealers’ Net Worth. Measured as a percent of total assets, dealers’ net worth for the 10 years studied ranged from a low of 25% in 1990 to a high of 35% in 1975 (Fig. 10). Averaged over the 10 years covered in this report, dealers’ net worth was 29%.
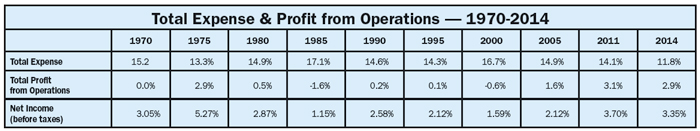
Expense & Profits. The average bottom line for North American farm equipment dealers of the years covered in this report, as a percent of sales, was 2.78% (Table 1). There was no real correlation for years when total expenses were higher vs. profit from operations or net profits.
Highest total expenses came in 1985 (17.1%) and 2000 (16.7%). The best years for total profits from operations occurred in 2010 (3.1%), 1975 (2.9%) and 2014 (2.9%). The best four years for net profits came in 1970 (3.1%) and 1975 (5.3%), and then again in 2010 (3.7%) and 2014 (3.3%).
“As you see, debt-to-equity has not changed much over the years,” says Birkey. “But what is interesting is that most dealers have a very low debt-to-equity because they have been in business for many years and have paid down on debt which in and of itself is not bad. However, the return on that is just the interest rate you are paying on the money borrowed.
“If your debt-to-equity ratio is not high and the data shown here does not show a high level,” Birkey explains, “then you should look at areas of your business where you can invest that will bring a greater return than the cost of money borrowed.
He says dealers should look at areas of their business that can provide a return that is multiple times the return of borrowed money. But he warns, “Herein could lie a money pit as well. You need to invest in those areas that truly do provide that return. If all you are doing is paying down on debt and pulling money out of the business for your pocketbook, you might not have something that is worth a lot when you go to retire.
According to Birkey, a better measurement is to look at the assets that you have on your books and compare that to your equity.
If you turn your total assets well, of which new and used inventory is normally by far the largest component, you’ll be in a much better position to weather the tough times. In the end,” he says, “a strong return on assets will provide the shareholder reasonable returns on equity. Low return on assets could put you out of business in harder times.”
Click to enlarge
Final Comments & Advice
Based on their experience, each of the veteran panelists who participated in the preparation of this special report was invited to offer some final words, and perhaps advice, to farm equipment dealers of today and, hopefully, tomorrow.
David Kahler: “As I think about what advice I would pass on for the dealer of the future, it would not be too much different than the advice I would have made 10 or 20 years ago. That is to maintain strong gross profits on new and used wholegood sales. Manage your used inventory daily and watch your investment in used. Don’t be afraid to wholesale it out when it gets too old. Also, maintain strong parts turns and margins.
“New for the modern dealer would be to consider hiring a dedicated warrantee specialist. Consider hiring dedicated parts and service sales employees to sell, sell, sell the aftermarket products. Consider hiring a precision ag specialist to be the expert in your total AOR that everyone comes to for information. Finally, for all dealers and especially the multi-store dealerships, control overhead and rolling stock expenses.”
John Walker: “My particular disappointment is that in the farm industry the dealer’s aftermarket has held pretty steady, particularly in the percentage growth of service and parts contribution.
“Take the average dealer in the 2014 CODB study with total sales of $14,677,453 and service contribution of 5.4%. What if in 2015 he achieved a contribution from service of 8.2%? His service sales would increase by $511,551 and if his margins remained at 60.99%, his profit dollars would increase by $311,534. This is certainly not ‘chump change’ for the first years’ effort at marketing his service department. You might also factor in a 15-18% increase in parts sales, which occurs with our test cases.”
Ron Birkey: “As dealers, we need to know what we need to be doing today to be successful and figure out what our action plan is to achieve our goals. If you start with a clear understanding of the financial metrics and know which ones are most important, you’ll be on the right track. The next step would be to understand where these same critical financial metrics will be in the next 3, 6 and 12 months, which will help you to make the necessary changes to keep your ship on the right track.”
Click to enlarge