The best thing about 2020 is it’s over! 2020 was a year with more challenges and setbacks than anyone could have game planned. It seemed for every step forward there were three steps back. Between COVID-19, drought, social unrest and record low commodity prices for most of the year, 2020 will be a year to forget. With all of the turmoil and negative news day-in-and-day-out, the U.S. farm was still able to have a good year. Various government programs, La Nina weather patterns in South America, and high Chinese Export Demand Commodity prices have rebounded nicely. Corn is trading in the $4.20-$4.30 range, making cash corn close to or at $4.00. So what does all this mean for the equipment space?
I am fortunate to have a historical database of retail equipment listings dating back Jan.1, 2015, to the present. This data set shows how many machines are listed at the beginning of each month. I use this data to look at trend lines and make my best guess of where used equipment is going. Like most months, I have my concerns with used combines.
If you listen to me on the “Moving Iron Podcast,” you know I have concerns about the 2012-2014 model combines and their effect on the used equipment marketplace. With the increased available on-farm income, much-needed equipment upgrades will be made and more 2012-2014 model year will be added to the used equipment sales channel. The positive note is used combine inventories are as low now as they were in the fall of 2017. The reason this is important is, in my opinion, fall 2017 was the end of the “Purge” that happened in 2014 through 2017. In August-November of 2017, many combines were sold at auction, with the high watermark in August of 590 combines sold. This auction activity reinforced two very crucial points. 2012-2014 Model combines have a steady auction price, and late-model and low-hour combines are in ravenous demand. Part of the databases I have access to also tracks retail machine listings by hour segments. I have included a snapshot from June 1, 2019 – December 1, 2020.
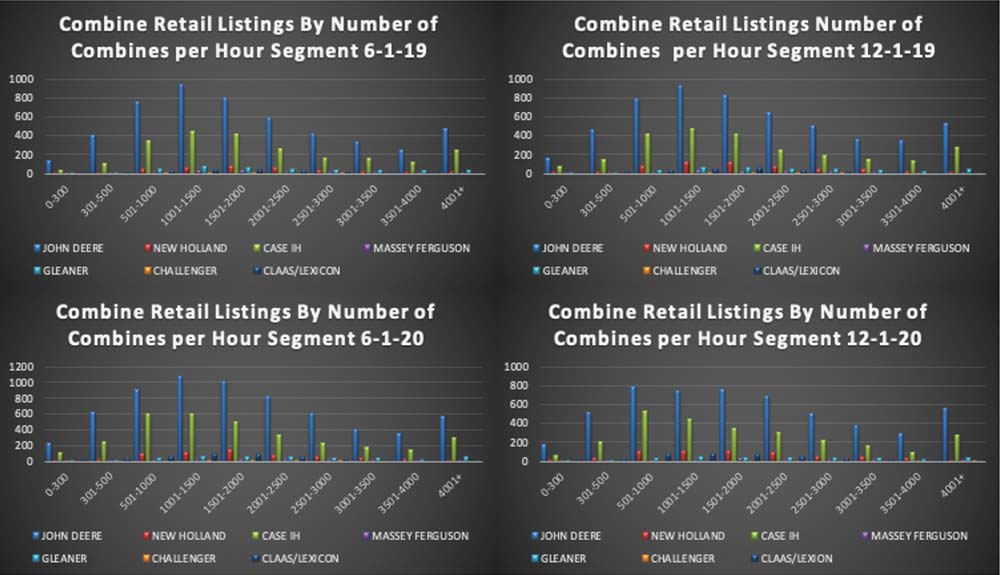
What I pay close attention to is where are the lowest and highest number of machines and what is the makeup of each. What I see is in the past year, the hour ranges of 501-1,000, 1001-1,500, 1,501-2,000 and 2,001-2,500 all look the same except for “12-1-20.” These segments house the 2012-2014 model combines, and what I fear is these segments will snowball as new and “new to me” machines are sold.
The other segment to watch and pay extra close attention to is the 0-300 hour range. This number hasn’t changed much and is, at all times, low inventory availability. If you are reading this and have a combine with these kinds of hours, this is the first time in the past 5-7 years it will make sense to trade for a new machine. Since early fall, the market is hungry for machines like these, and auction value will prove it.
I want to compare 2021-2022 to 2009-2010 because they mirror each other very closely. Crop prices were coming out of a down period and were slowing climbing to the $8.00 corn of 2012. If I had the same hour segment graphing for the 2009-2010 time period, it would show the graph’s opposite side as the problem. In late 2009, the 1-year-old combine saturated the market. There was very little else to choose from, and the washout cycle was stuck in the park! Trying to get a buyer to look at used combines first and new combines second proved to be a more challenging sale than expected and lead to a massive sell-off 3-4 years later.
As more and more 2012-2014 model year combines come to market via trade, a similar situation could be unfolding. However, the 2012-2014 model years have an established auction value now. What happens as supply goes up and demand goes down? Like the buyers who have 0-300 hour machines, the sooner you decide to upgrade, the better your situation will be. History is playing the same song, except there is a slightly different dance this time.


Post a comment
Report Abusive Comment