Sales management in farm equipment dealerships is undergoing major changes in which measuring the performance of the salesforce is becoming increasingly critical. These changes are being forced by the growing size and demands of farming operations that require more attention from the sales team, as well as the expansion of dealership operations via industry consolidation. Effectively managing and measuring the dealership’s efforts and subsequent results is essential for increasing profits.
While close attention to internal metrics and comparing these to past performance remains important, determining where the dealership stands compared to similar operations and its competition is an essential component in determining overall sales performance. One of the methods for doing so is through benchmarking.
To make these comparisons, this Farm Equipment 2019 Confidential Sales Survey was compiled by the editors of Farm Equipment to help dealerships evaluate the performance of their salesforce compared to an industry baseline.
This report is based on results of an April 2019 survey of sales managers, sales directors, general managers and dealer-principals for farm equipment dealers in the U.S. and Canada. Nearly 200 responses were collected for the report.
This report is broken out into the following sections:
- Part 1: Dealership Characteristics
- Part 2: Characteristics of the Dealership Salesforce
It is important to note that the results of this survey are representative of the survey respondents and not necessarily a perfect representation of the market as a whole. These results serve as a window for what the market looks like for some.
Part 1: Dealership Characteristics
This section of the report breaks out the survey respondents by annual revenue. This breakdown is further segmented by source of the dealerships’ revenue. This includes percent of 2018 revenue from production ag customers, rural lifestylers and large property owners, and lawn, turf & landscape contractors. All other sources of annual revenue were combined into an “other” category.
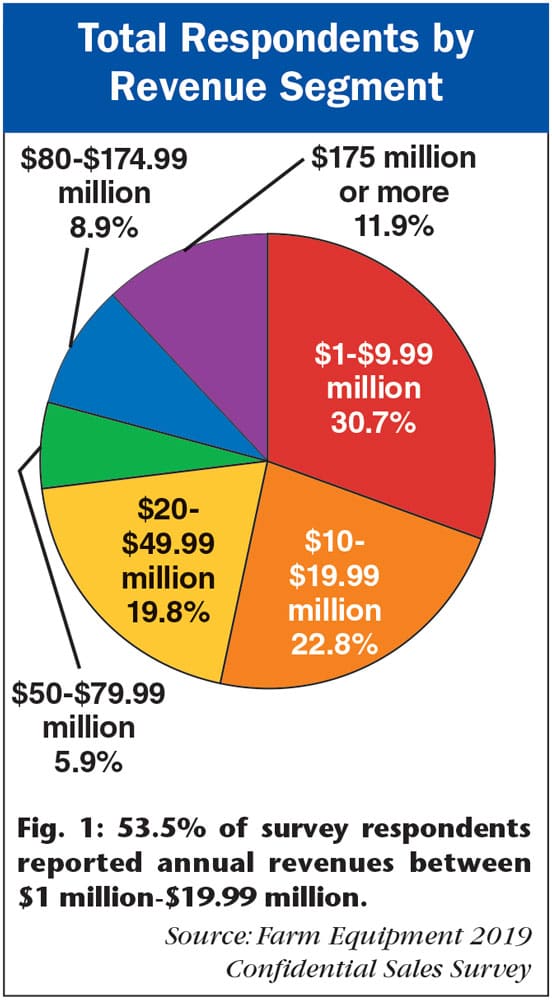
Out of the responses to this survey, over 53% of respondents were operating dealerships with annual revenue under $20 million (Fig. 1). The most common revenue range of respondents was $1 million-$9.99 million with 30.7%. The annual revenue range with the lowest amount of respondents was $50-$79.99 million.
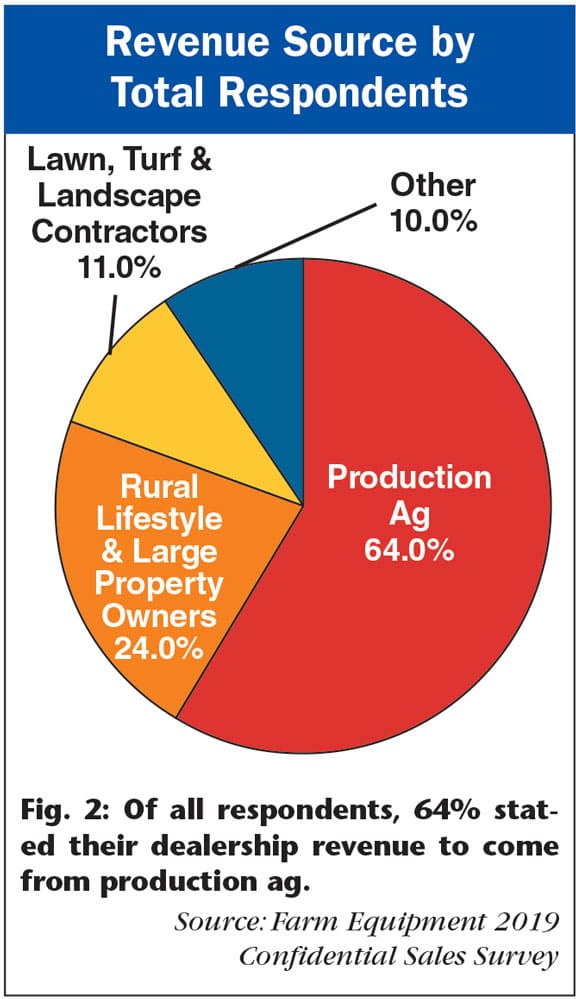
Overall, 64% of dealers’ 2018 revenue was attributed to customers involved in production agriculture and commercial farming operations (Fig. 2). Rural lifestylers and large property owners accounted for 24% of dealer revenues in 2018, while business from commercial lawn, turf & landscape contractors made up 11% of revenues. “Other” sources of sales revenues accounted for roughly 10% of dealer sales in 2018.
Revenue Segment vs. Revenue Sources
A trend found when looking at the revenue source of respondents was that, those indicating lower annual revenues tended to have a smaller percentage of production ag accounting for their overall revenue. In these instances, respondents reported more reliance on rural lifestyle and landscape contractor customer bases for sales.
For example, for survey respondents reporting annual revenue less than $20 million, an average of 57.1% of revenue comes from production ag and an average of 28% from rural lifestyle and landscape markets (Table 1).
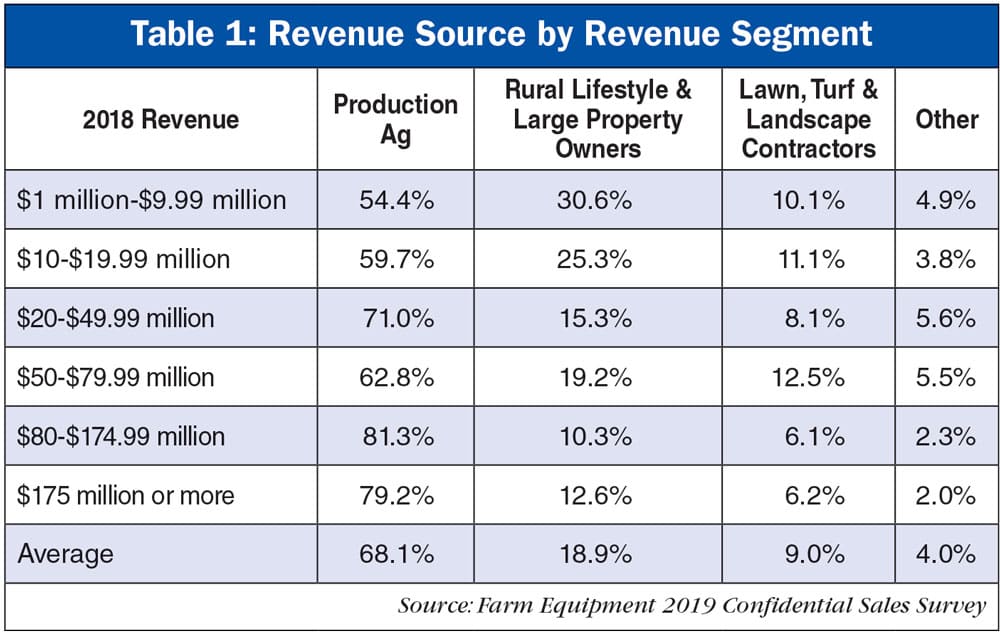
The significant variation occurs with dealers reporting $20-$49.99 million in annual sales and those in the next category of $50-$79.99 million. Dealers in the lower revenue group attribute 71% of annual revenue to production ag but those in the high revenue category says that only 62.8% of revenue is accounted for by production ag, an 8.2% difference (Table 1).
Respondents with dealerships in the over $80 million annual revenue category report that an average of 80.3% of their annual sales are attributable to production ag and an average of 11.5% result from sales to rural lifestyle and landscape segments (Table 1).
Greatest Success in Sales Structure/Management in the Last Year
“Reworking the compensation system and the development of a reporting system for sales team members.” … “A dedicated sales manager that mainly stays at the dealership to oversee the sales department and handle walk-in customers.” … “Having one person to do trade approvals and coming up with a very specific way of dealing with inventory as it gets older.” … “Outside sales training.”
“Learning more about how to evaluate used equipment and becoming aware of what will sell in today’s economy.” … “Centralizing the valuation of inventory management and used equipment valuation.” … “Setting up more appointments and making less cold calls.” … “Better at trade values.” … “Improved compensation packages for junior salespeople to attract and retain them.” … “Building on existing relationships and adding new key accounts with enhanced product offerings.”
“Developing a calendar of tasks related to sales support.” … “Changing our compensation plan for our sales team. Compensation plans won’t make poor salespeople good salespeople but they will drive behavior. We needed to change the behavior of our sales team based on where the industry is headed.” … “Better follow ups and better mailing lists.” … “More effective on farm sales support.” … “Inventory management changes.”
“Teamwork amongst the sales team. The more our managers encourage the flow of information throughout the organization, the better our sales performance becomes.” … “Adding digital marketing and enforcing CRM.” … “Changing senior salespeople and sales manager commission from per sale monthly to total dealership profit annually.” … “We moved to a regional manager structure to improve communication and responses to customer needs.”
“More accountability of salespeople through better one-on-ones with managers.” … “Hiring people outside of the dealership world with great customer service and sales skills. This has been an important change in the last few years. Starting fresh without bringing in someone with bad habits from another dealer has been important for success.” … “Splitting territories up into smaller areas and hiring new salespeople.” … “Implementing a new call strategy.”
“Driving home the need for strong gross margins on both new and used.” … “Switching some people to inside sales so that the field salespeople can stay out more.” … “Focusing training by specialty,” … “We have reduced the amount of paperwork that our sales people do by adding some of those responsibilities to current office personnel.” … “In house product training.” … “Implementing an inside sales team for follow up on used equipment leads.”
“Decreasing inventory by half and shifting our sales process to a pre-sell first mentality.” … “Letting the reins loose on young salespeople.” … “Cross training so salespeople can help with parts when needed.” … “Making sure we have inventory, the staff is knowledgeable on equipment and we have competitive prices.” … “Creating a better purchase order system.” … “Doing a better job of tracking on farm visits and customer interface.” … “Having competition with sales goals.”
Part 2: Characteristics of the Dealership Salesforce
Results of Farm Equipment’s survey of sales managers, directors and general managers also provided a review of dealership sales staff and how differing compensation plans and commission programs are being used for junior and senior salespeople.
When it comes to the age of the salesforce, data indicates that the largest percentage of salespeople fall into the 31-60 year old age group. On average, more than 91% of their sales teams are over 30 years old (Table 2).
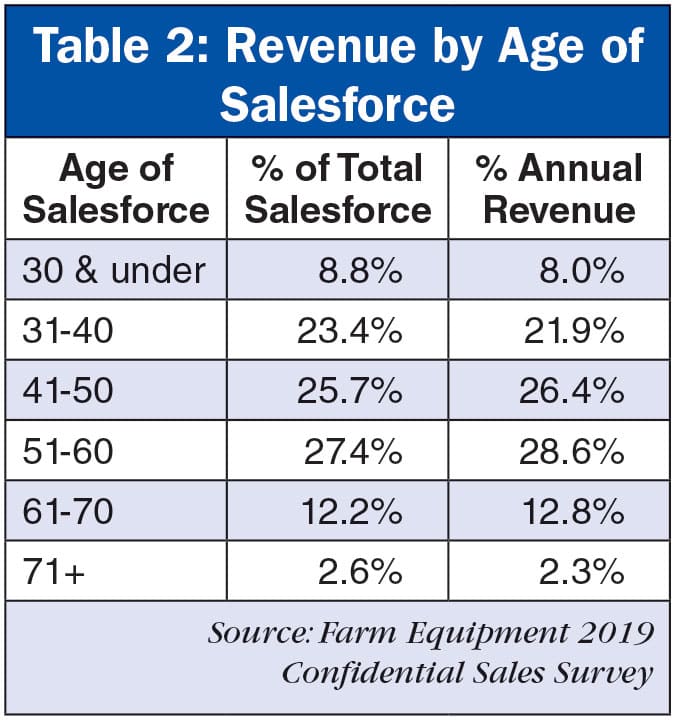
The largest group by a small margin are those at age 51-60, accounting for 27.4% of the salesforce. The bulk of the average dealer’s sales revenue falls with ages 41-50 years old (26.4%) and 51-60 years old (28.6%).
“What this shows is that age is not a determinant for how many sales one can make or their productivity,” says George Russell, Machinery Advisors Consortium. “My theory is that there are older salespeople who actually aren’t doing a very good job. They aren’t generating a lot of business.
“We think that seniority is a good thing but the fact is, older salespeople continue working on their existing customer base and often aren’t going out and talking to somebody new. I also believe that younger salespeople can be taught how to sell relatively quickly. In other words, I don’t think you have to spend x number of years on the job in order to be successful. Sales ability is not limited to age or experience. Young people can learn the trade quickly and be productive.”
Senior vs. Junior Salespeople
Respondents were asked to compare their junior and senior salespeople based on the number of accounts assigned, the expected calls per week and expected farm visits per week. Generally, as annual revenue increased, the number of accounts assigned, expected calls and expected farm visits went down for both juniors and seniors.
On average, senior salespeople are assigned 158.3 accounts, expected to make 34.2 calls per week and expected to visit 13.7 farms per week. Junior salespeople are assigned an average of 102.2 accounts, expected to make 33 calls per week and expected to visit 13 farms per week (Table 3).
While the number of accounts assigned change based on revenue, there are breakdowns that show large differences between junior and senior salespeople. For instance, in locations with annual revenue between $1 million-$9.99 million, senior salespeople have 227.6 accounts assigned to them on average vs. 141 for junior salespeople (Table 3). Another noticeable difference can be seen in dealerships reporting annual revenue between $10-$19.99 million. Here, senior salespeople have an average of 165.9 accounts assigned while juniors have only 70.2 (Table 3).
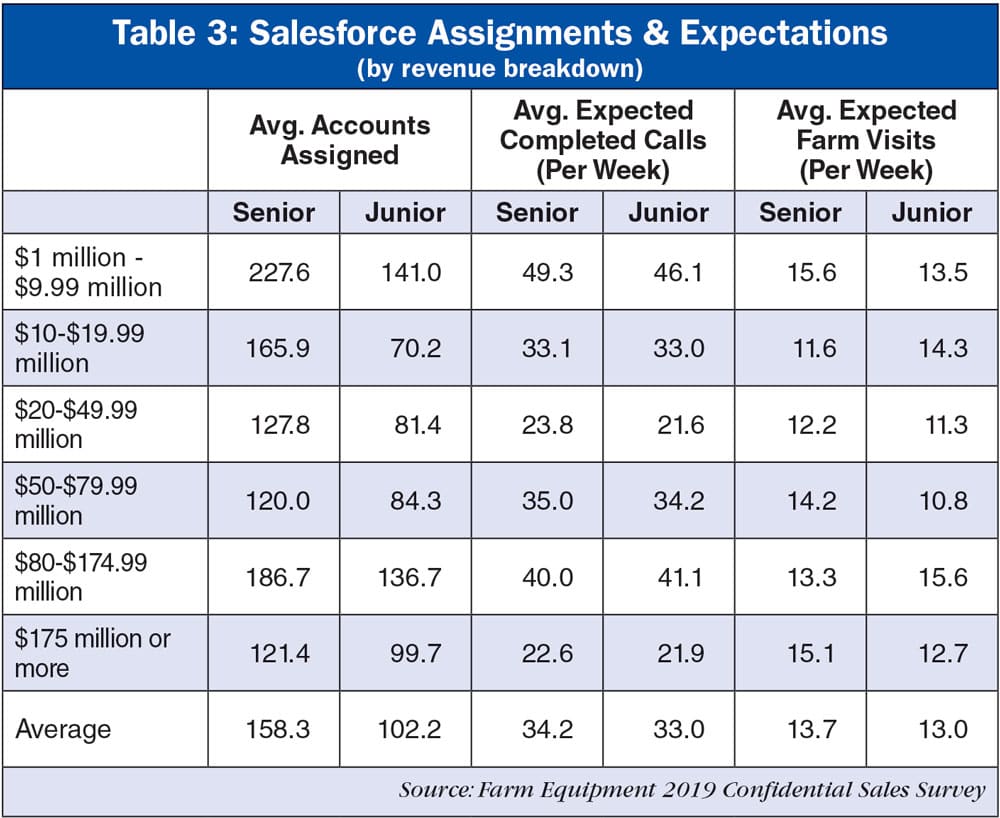
Overall, the $20-$49.99 million annual revenue range dropped in accounts assigned, expected calls and expected farm visits for junior and senior salespeople. For example, the number of accounts assigned to senior salespeople was 127.8 and junior salespeople had 81.4 vs. 165.9 for seniors and 70.2 for juniors in dealerships with revenue between $10-$19.99 million. There was then a large surge in those numbers for dealerships with revenues in the $80-$174.99 million dollar range (senior salespeople were assigned, on average, 186.7 and junior salespeople 136.7). This dropped back down with the over $175 million in annual revenue dealerships (senior salespeople 121.4 and junior salespeople 99.7).
While some of the numbers may be high, this is not abnormal, says Russell. “It’s not surprising to see some with higher numbers because dealers often have too many accounts assigned to begin with.”
Compensation Programs
With compensation programs, junior salespeople often work with a fixed salary while senior salespeople work based sales commission/incentives.
On average, senior salespeople are slightly more likely, 51.5%, to receive sales commissions/incentives rather than fixed salaries (Table 4). With junior salespeople, compensation tends to lean toward fixed salaries (55.6%).
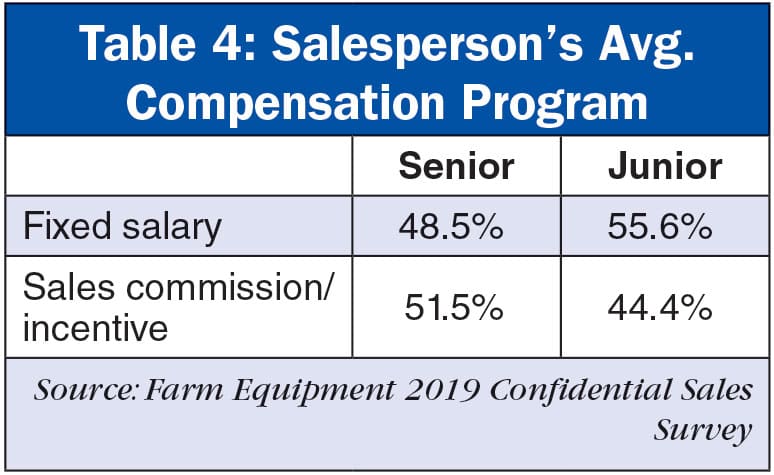
See, “How is the commission structure calculated at your dealership?” to find out what some of the respondents are doing at their dealerships.
How is the commission structure calculated at your dealership?
$1 Million -$9.99 Million
“Percentage of net profit.” … “10% commission on net profit plus salary.” … “25% gross profit on new and 30% on used.” … “Weekly draw.” … “3% used and 2% new of gross difference plus draw salary.” … “Base set wage plus 15% sales profit.” … “Bonus at the end of year.” … “20% net profit on new, 25% net profit on used, fixed base salary to keep them from starving in the winter.” … “Commission from the manufacturer.” … “25% gross profit on new and 30% on used.” … “No commission until trade in is sold for profit.”
$10-19.99 Million
“Base pay and commission on profit after expenses.” … “Percentage of net profit.” … “Commission is the salesman bonus from OEM. Also have small bonuses for total dollars of sales such as $2,000 for every million dollars sold.” … “Company programs.” … “Senior is salaried with a 10% commission on total dealership profit. Junior is salary plus 10% commission monthly on sales profit.” … “Gross margin of sales; 25% no trade and 20% with trade.” … “Salesperson keeps any manufacturer or lender incentives. They are paid a year end bonus based on profitability.”
$20-$49.99 Million
“$20,000 base salary and 20% of gross margin.” … “Percentage of net profit with a hold back on a portion if a trade is taken. Balance paid when trade sells.” … “1% of trade difference.” … “Percentage of gross profit for new and used.” … “Salary plus 5-10% commission.” … “Anything below $15,000, the salesperson gets 2.5% of the total sale. Anything above $15,000, the salesperson gets 20% of the total profit of the sale.” … “$45,000 base salary with 10% commission.”
$50-79.99 Million
“Percent of gross margin.” … “Salary plus 25% gross profit.” … “30% of net profit after a 2 year training period.” … “Percentage of cash difference.” … “30% of net profit after a 2 year training period.” … “Base salary plus 10% of gross margin with a 50% hold back for trade-ins that is not paid until the trade-in is sold.”
$80-$174.99 Million
“Base plus commission.” … “Percentage of gross profit on each sale. Higher percentage for used equipment.” … “20% on new and 30% on used.” … “Straight commission of 25% profit.” … “Percentage of gross margin that varies depending on new or used and is tiered by gross margin percentage.”
$175 Million or More
“Quarterly pool incentives divided equally among qualifying salesmen. All manufacturer and outside financial spiffs go to the salesmen.” … “New equipment incentive plus a percentage of new equipment margin and a percentage of trade-in sales margins.” … “Gross margin with bonus for hitting certain metrics.” … “Percentage of gross margin with a reserve held back and paid on the salesman’s used turn of equipment.” … “10% margin on new and 15% on used.”
Percentage of Company Revenue by Salesperson
When looking at the percentage of company sales one salesperson accounts for, as the revenue size increases, the weighted average decreases. For example, respondents with annual revenue between $1 million-$9.99 million, the average salesperson accounts for 52.8% vs. 11.5% in dealerships with annual revenues over $175 million.
For most dealerships (28.2%), the average percent of company sales any one salesperson accounts for in a dealership less than 11%. As annual revenue increases, a single salesperson tends to account for less of a percentage of company sales (Table 5).
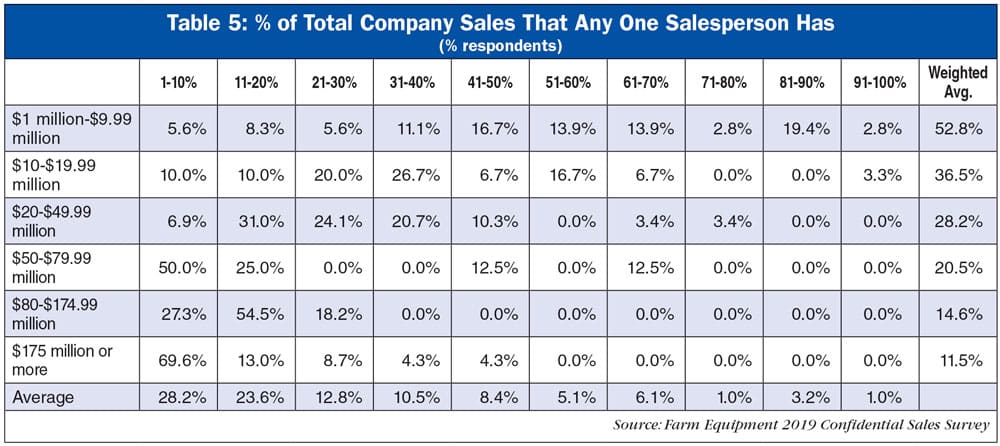
For example, in the smallest revenue generating dealerships ($1 million-$9.99 million) 19.4% reported that a single salesperson accounts for 81-90% of company sales. Moving up to the next revenue bracket, $10-$19.99 million, the greatest number of dealerships (26.7%) report that they have a salesperson that is responsible for 31-40% of company sales (Table 5).
In both the $20-$49.99 million and $80-$174.99 million revenue segments, most respondents report having a single salesperson who accounts for 11-20% of company sales (31% for $20-$49.99 million and 54.5% for $80-$174.99 million). The remaining revenue segments mostly reported that a single salesperson accounts from 1-10% of sales (50% for $50-$79.99 million and 69.6% for $175 million or more).
Call Center Arrangements
When asked about a call center type arrangement, survey respondents were given the following options: appointments/equipment demos, used equipment sales, parts and service specials, and “does not apply.” Most revenue ranges offered call centers for used equipment sales and parts and service specials (Table 6)
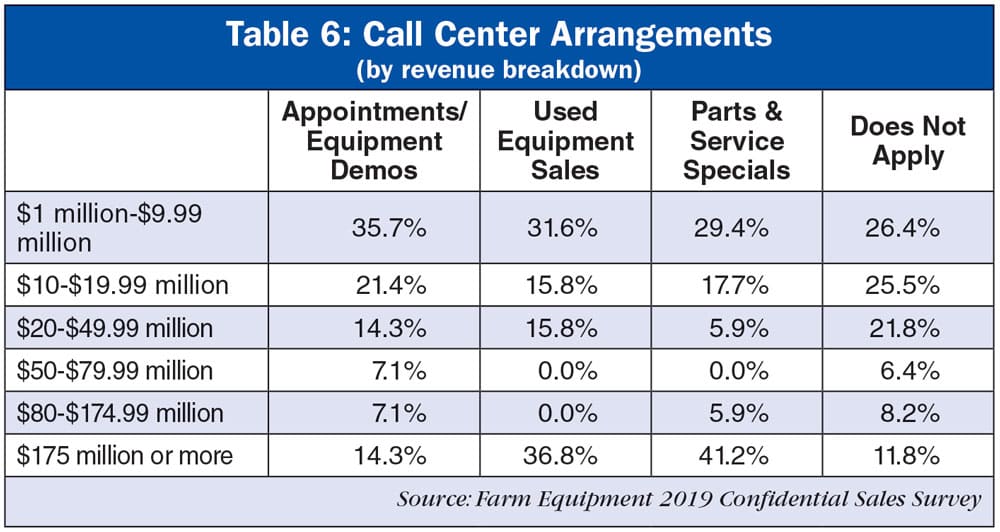
Respondents operating dealerships with annual revenues between $1 million-$9.99 million were closely split among the four options with call centers for appointments/equipment demos being the highest with 35.7% (Table 6). In the $10-$19.99 million, most respondents responded with does not apply (25.5%) or that they operated call centers for appointment/equipment demos (21.4%). Respondents with dealerships in the $20-$49.99 million revenue range also were more likely to respond with “does not apply” (21.8%).
This changes when looking at dealerships reporting revenues of $175 million or more. With these dealerships, call centers were more likely to be set up for used equipment sales (36.8%) and parts and service specials (41.2%).
Expectations for the Salesforce
To determine how well a dealership’s salesforce was meeting expectations, respondents were asked to provide a ranking for a number of scenarios including tracking contacts, passing along work opportunities and following through on marketing generated leads.
In seven of the eight categories a majority of respondents stated that the salesforce “sometimes meets expectations” (Table 7). Recruiting additional talent for the dealership was the only category in which “sometimes meets expectations” was not the majority. In this case 40.3% answered with “rarely meets expectations.”
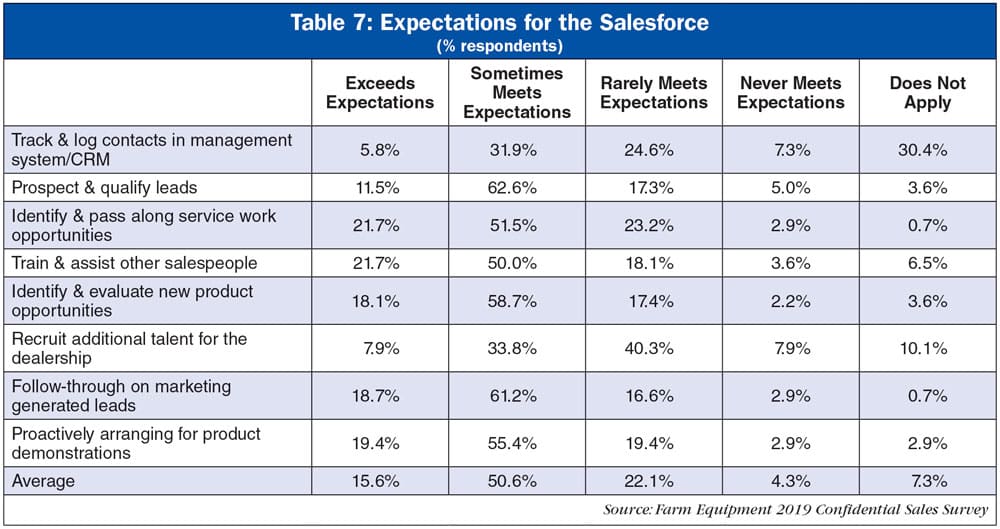
Taking a closer look, only three of the categories — train & assist other salespeople, identify & evaluate new product opportunities, and follow through on marketing generated leads — had “exceeds expectations” second in the rankings behind “sometimes meets expectations.” Overall, respondents were more likely to say their teams rarely met expectations (avg. 22.1%) than exceeded expectations (avg. 15.6%).
Account Forecast Reviews
Respondents were asked how often salespeoples’ account forecasts were reviewed by management. The survey results showed that dealerships with higher revenues were more likely to have consistent reviews of accounts. Most dealers, 31.2% on average, reported reviewing accounts monthly, followed by another 21.4% reviewing them weekly (Table 8).
A closer look shows some areas with slight differences. In dealerships with $50-$79.99 million in annual revenue, weekly forecast reviews were just as likely as never reviewing accounts at 25% (Table 8). As dealerships with revenue between $1 million-$9.99 million (33.3%) and $10-$19.99 million (34.5%), it was more likely that accounts were not reviewed.
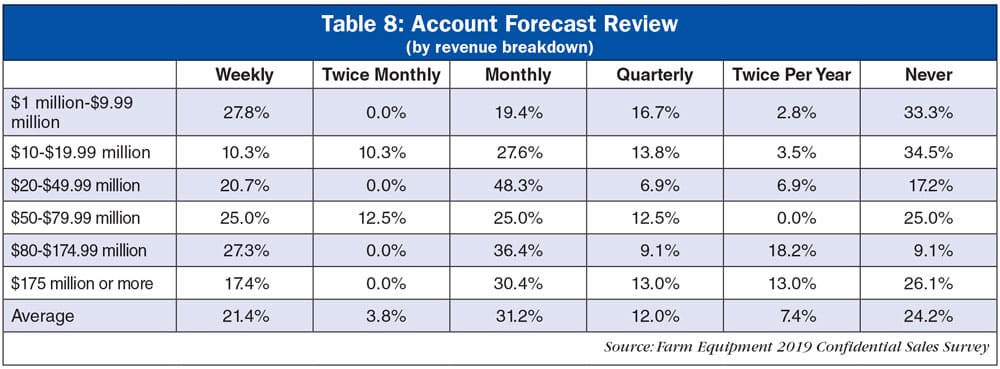
Worth pointing out is that an average 24.2% of respondents reported that they never review accounts. Russell was not surprised by this number. “It’s because the dealerships need to have more processes when they do sales management,” he says. “Some do that [have processes] and some don’t.”
How Dealership Sales Management is Organized
Farm Equipment further broke down the data by management structure: centralized with the sales director at headquarters office, centralized with a regional sales director and decentralized with management handled at the store level.
Dealerships that reported revenues below $50 million tended to have either a decentralized management structure with sales management at the store level or centralized management with a sales director at headquarters office. Specifically, dealerships with revenue in the $1 million-$9.99 million range 51.6% run centralized management with a sales director at headquarters and 45.2% run a decentralized structure (Table 9).
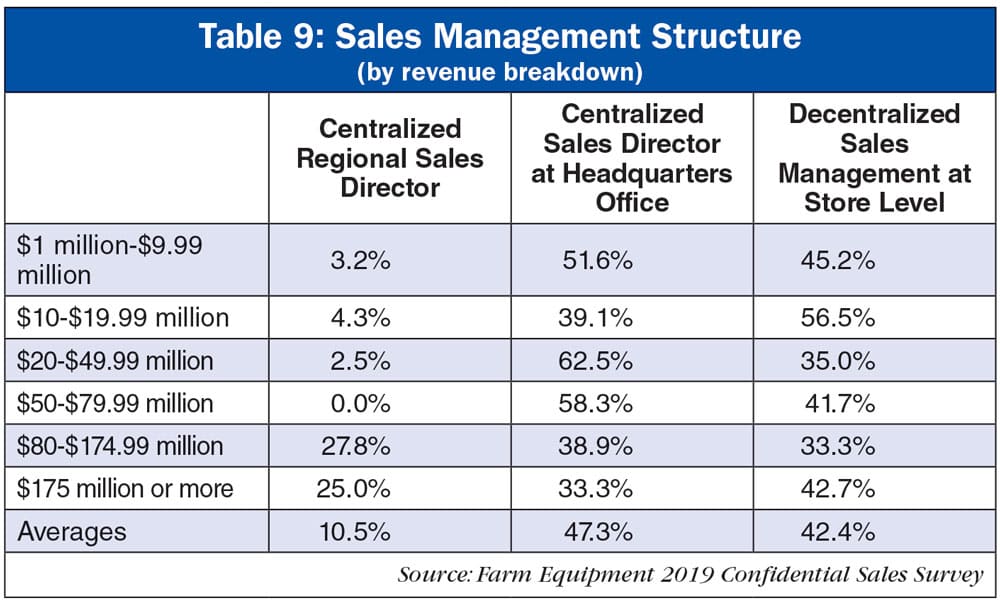
A decentralized management structure was most common in stores with annual revenues of $10-$19.99 million, with 56.5% (Table 9). Most of the dealerships with annual revenue in the $20-$49.99 million range reported having a centralized management structure with the sales director at the headquarters office (62.5%).
With dealerships making $80 million or more in annual revenue, most respondents (27.8% and 25%) reported their management structure as centralized with a regional sales director.
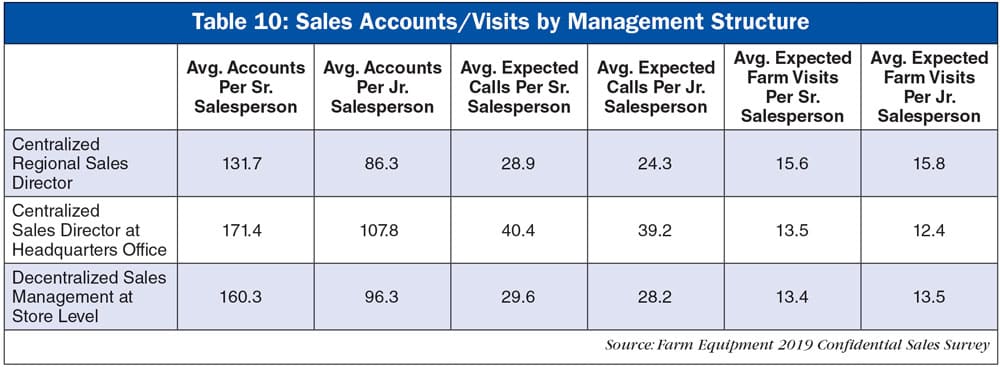
Expectations by Sales Management Structure
On average, dealerships operating under a centralized system with the sales director at headquarters office tended to have slightly higher expectations for their salesforce (Table 10). In every category (except expected farm visits for junior salespeople) respondents expected more calls and farm visits, and assigned more accounts to both junior and senior salespeople than what is seen in other management structures.
A large portion of dealerships operating under centralized management structure with the sales director at headquarters office have revenue between $1 million-$49.99 million (51.6% $1 million-$9.99 million, 39.1% $10-$19.99 million, 62.5% $20-$49.99 million). It is worth noting that while 39.1% of respondents with revenues from $10-$19.99 million run a centralized management structure with the sales director at headquarters office, a majority, 56.5%, run a decentralized management structure (Table 9).
An interesting result of the survey when looking at this decentralized management structure is in the accounts assigned in the $80-$174.99 million in revenue range (Table 11). Here, the average number of accounts for a senior salesperson is, on average, 250 and 206.3 for a junior salesperson. The only other revenue range that gets close to this number is $1 million-$9.99 million with senior salespeople having 196.8 and junior salespeople having 132.7 accounts assigned (Table 11).
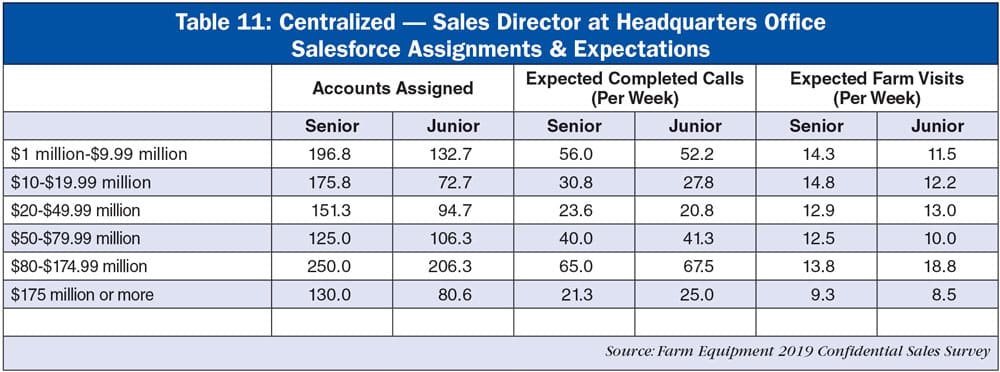
It is also worth looking at senior vs. junior salespeople in dealerships with revenue between $80-$174.99 million for centralized management structure with the sales director at headquarters office. Here, junior salespeople tend to be expected to make more calls and farm visits than senior salespeople (Table 11).
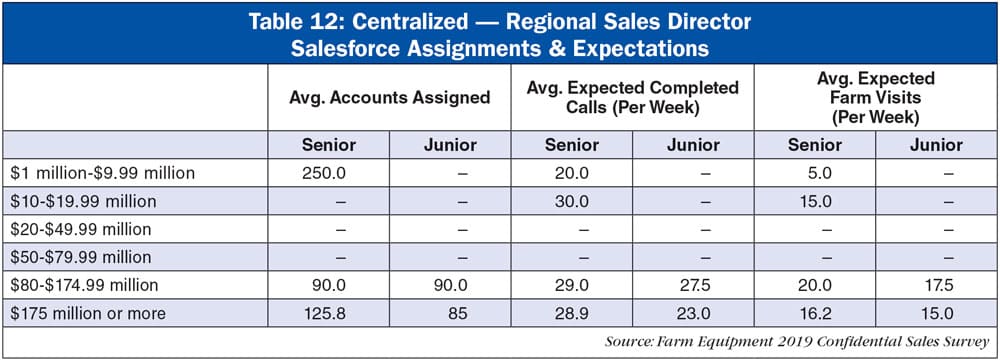
A large amount of the dealerships running a centralized management structure with a regional sales director have revenue between $80-$175 million (Table 12). The dealerships with less in annual revenue did not report numbers for junior salespeople, indicating that those smaller dealerships running this type of management structure may not have any on staff.
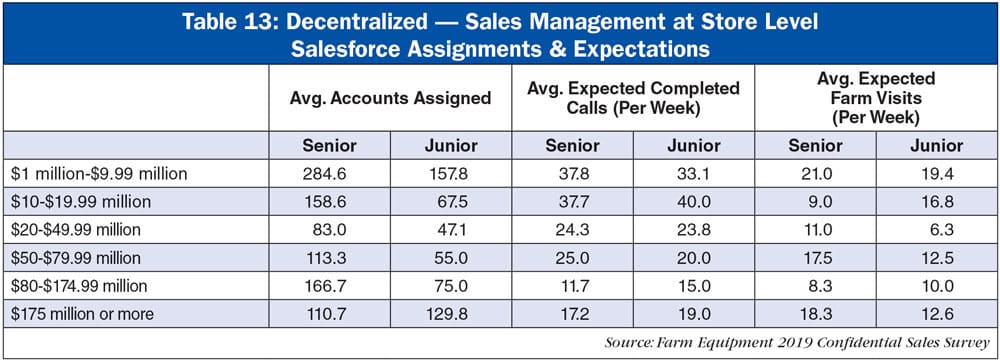
In dealerships with $20-$49.99 million in annual revenue, a drop in accounts assigned under the decentralized management structure can be seen (Table 13). In this revenue segment, senior salespeople are assigned, on average, 83 accounts and juniors are assigned 47.1. In the revenue segment just above this, $10-$19.99 million, seniors are assigned 158.6 and juniors 67.5.
With the centralized structure with a regional sales director, it is important to note that while some respondents report running this type of management, not all of those respondents shared their expectations for senior and junior salespeople.
Adding to the Salesforce
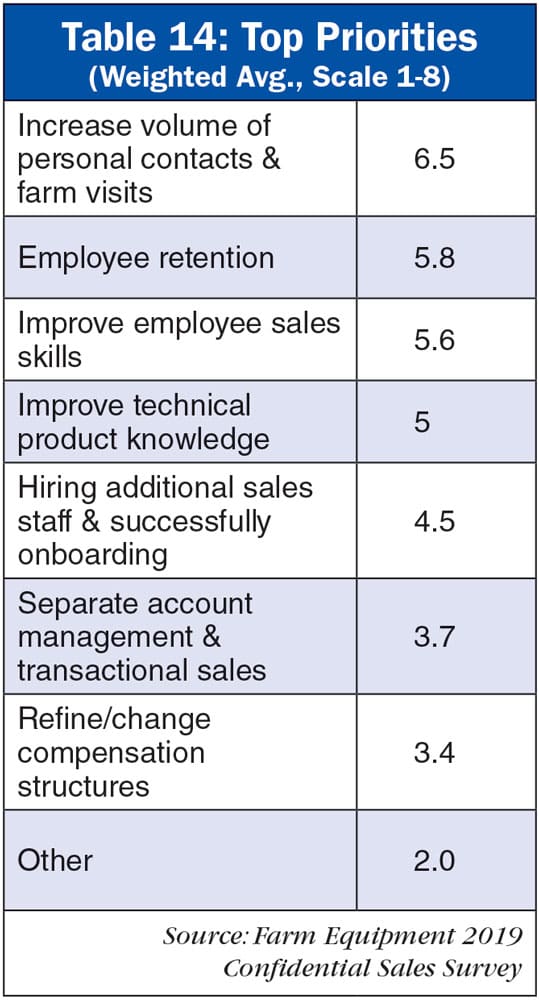
The top priority among all respondents was increasing their volume of personal contacts and farm visits (Table 14). Employee retention, an issue throughout the ag industry, was second on the list. The bottom two on the list of eight were, “refine/change compensation structures” and “other.” Write-in responses mentioned were adding CRM, furthering territory development, moving used inventory, improving procedures, increasing the number of demos and increasing profit margins.
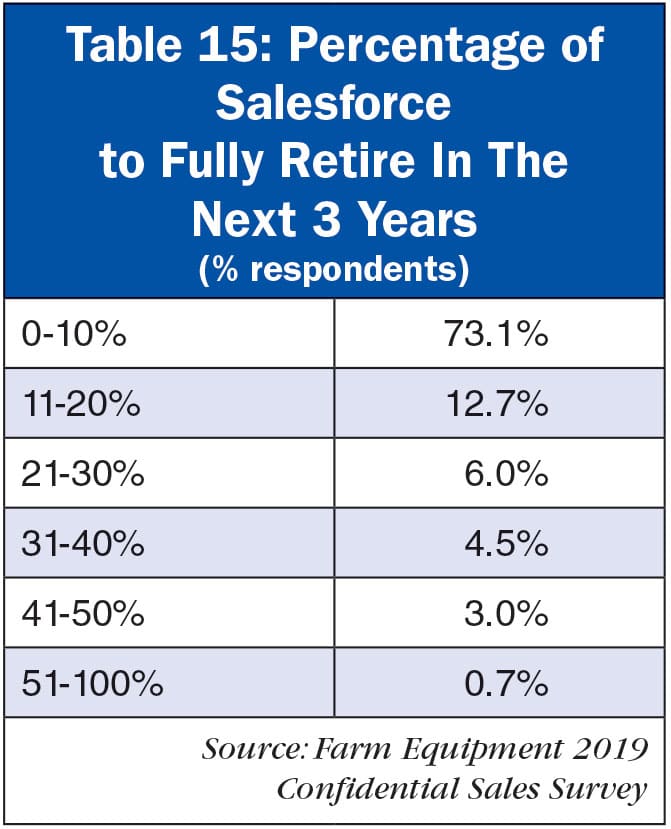
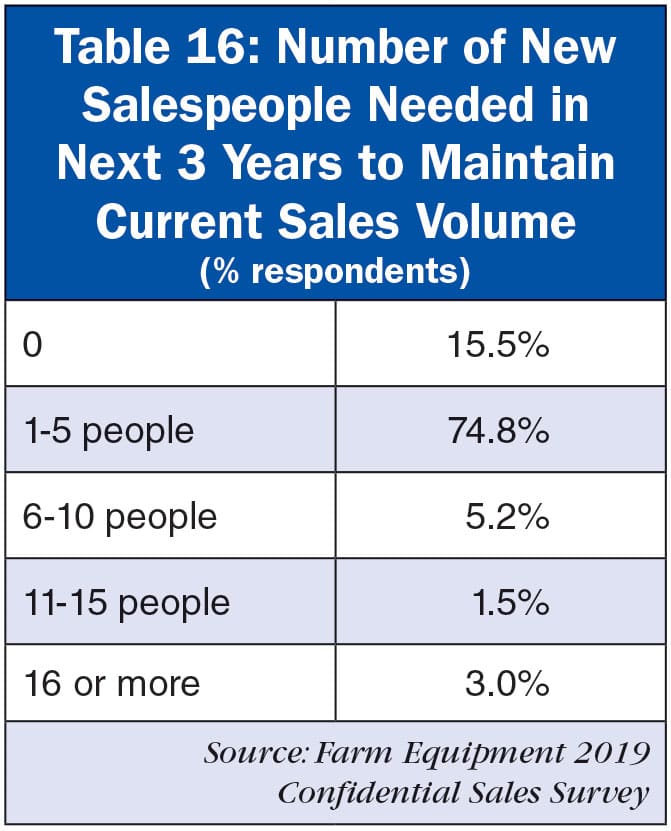
Hiring additional staff was in the middle of the list of priorities in total, 73.1% of respondents say fewer than 11% of their salesforce will retire in the next 3 years (Table 15). When asked how many salespeople they will need to hire to maintain current sales volume over the next 3 years, 74.8% of respondents said they would need 1-5 new employees (Table 16). Another 5.2% said they would need to hire 6-10 employees in that timeframe.
Despite the amount of workforce development programs popping up, finding staff from internships or fresh out of school was not where most respondents believed they would find future employees. In fact, finding employees through internships and out of school ranked fourth on the list of six options, sitting at only 16% (Table 17).
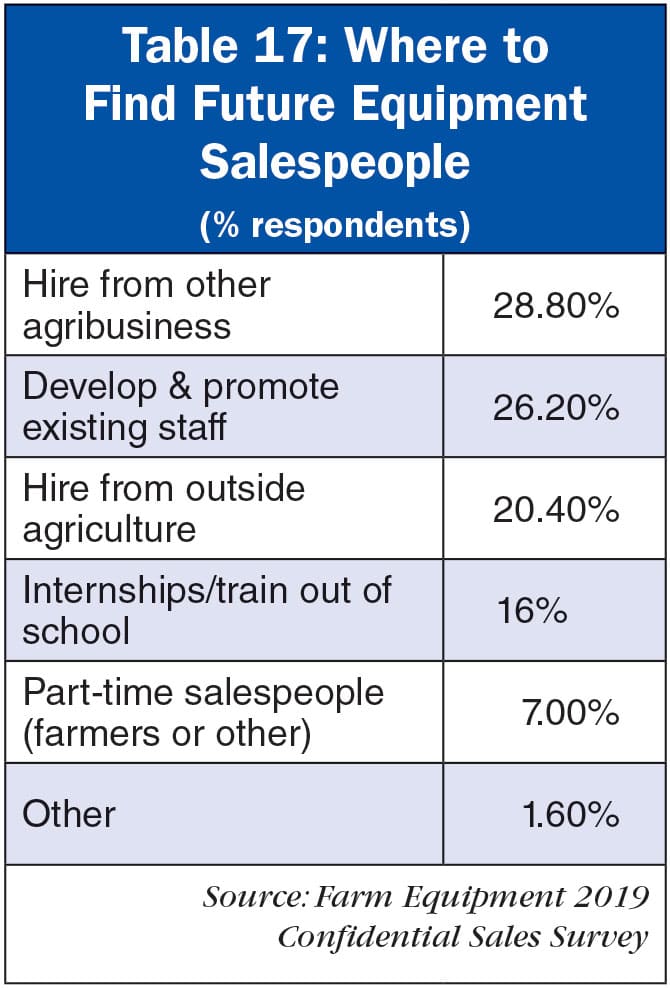
When asked where they would find tomorrow’s salespeople (Table 17), most of the respondents indicated that they would either hire from other agribusinesses (28.8%) or develop and promote existing staff (25.8%). Only 7.2% expect to solve the problem through the addition of part-time staff.


Post a comment
Report Abusive Comment