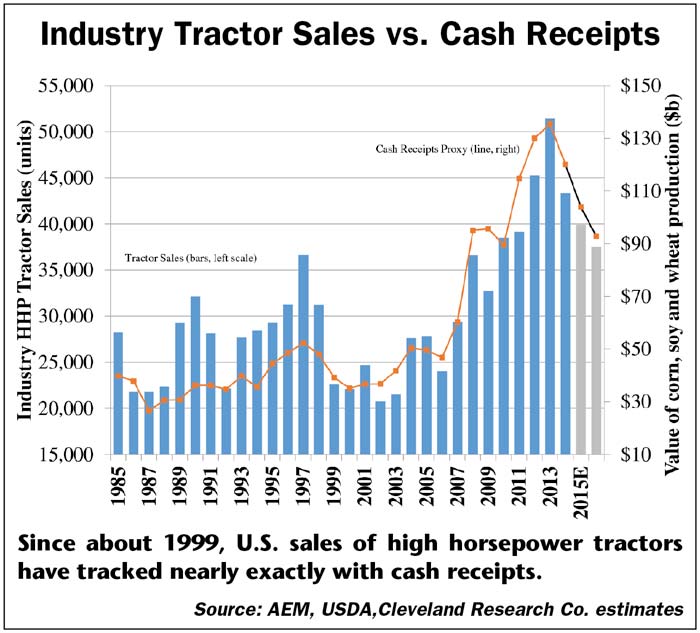
While net farm income or net cash income is the deciding factor in farmers’ level of investment in capital goods, like ag equipment, crop and/or cash (includes livestock) receipts have proven to be the best ongoing indicator of farmers’ income, and thus future tractor sales.
Since the late 1990s, the sales of high horse power tractors have tracked almost exactly with projected crop receipts.
The chart below illustrates how these two metrics are highly correlated.
In this case, crop receipts represent the value of corn, soybeans and wheat production in the U.S. Total cash receipts include crops plus livestock.
You May Also Be Interested In...

Case Study: When is Investing in a New Structure the Right Decision?
In this year's SOURCEBOOK Special Report, we went in-depth with 5 different scenarios examined in a format similar to Harvard Business Review case studies. In one case study, we explored how a consultant might approach a farmer questioning whether they should invest in a new building.
Since January of this year, estimated crop receipts have ranged from –13% in January, February and April to –6% in July. In USDA’s August World Ag Supply and Demand Estimates stocks-to-use forecasts were raised for corn and soybeans catching the industry off guard. Most industry observers expected a decrease in stocks. This lowered crop receipts outlook to –7% for the year, still much better than expectations from earlier in the year.
As a result, current price forecasts were reduced for all three major crops. For 2015-16, projected major crop cash receipts are expected to be $97.3 billion, down 7% year-over-year from $97.9 billion, or –6%, from last month.
If this holds true, it will be in line with the down 6% that USDA forecast for cash receipts earlier in 2015.


Post a comment
Report Abusive Comment