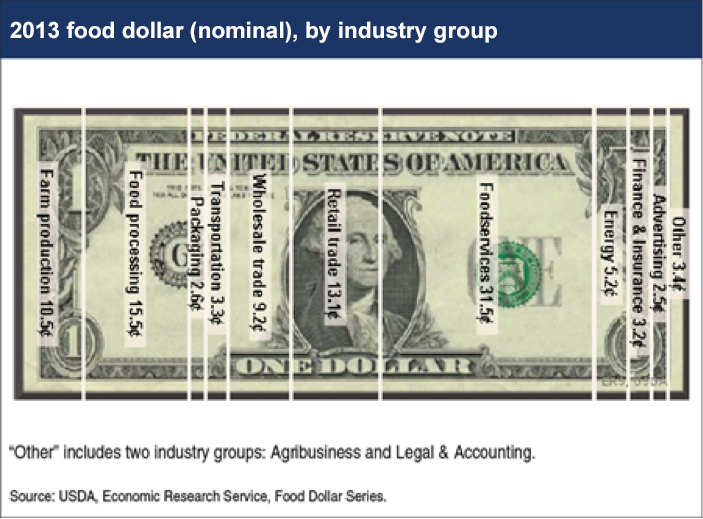
In the U.S., 10.5 cents of a typical dollar spent by consumers on domestically produced food in 2013 represented value added by farm producers, up 8% from the previous 2 years. Products and services provided to farmers by agribusinesses, such as fertilizers and veterinary services, accounted for 2.1 cents of the 2013 food dollar, down 12.5% from the previous year.
ERS uses input-output analysis to calculate the value added, or cost contributions, to the U.S. food dollar from 12 industry groups in the food supply chain. Annual shifts in food dollar shares between the industry groups occur for a variety of reasons, ranging from the mix of foods that consumers purchase to relative input costs. Energy is another industry group supplying goods and services to farm producers as well as to the other industry groups, and like agribusiness, the energy industries’ food dollar share declined in 2013. Energy costs accounted for 5.2 cents of the food dollar in 2013 compared to 5.6 cents in 2012.
This chart is from the ERS Food Dollar Series data product updated April 2015.


Post a comment
Report Abusive Comment